In this task, you check the project for errors. If you have
configured it correctly, you’ll see warnings but no errors. Warnings
indicate potential issues, such as absence of default events. It’s always
worth checking them. In the FraudDetection project, the
warnings do not indicate any actual issues.
How can I validate that there are no basic errors in my code? To perform checks that do not take project logic into account, use (or right-click on a project name, and use the same named option).
What if there are problems in my code? You can debug it. TIBCO BusinessEvents® Extreme builds on the Eclipse debugger features to provide additional checks. Developers familiar with the Eclipse debugger will find it intuitive to use.
How can I analyze that the logic of my project is OK? For this kind of checking you use Project Analyzer or the Element Diagram or both. They work together to provide insights into your project. Project Analyzer is a document generated in the Problems view area. Element Diagram provides a visualization of the whole project or of selected project elements. It also shows all dependencies in a project. Project Analyzer and Element Diagram can be configured to run separately or together, using preferences.
How can I change the names of project resources, or move them around? Use the refactoring features. They ensure that changes you make are reflected throughout the project (with certain limitations).
![[Note]](images/note.png) | |
In TIBCO BusinessEvents® Extreme Application Developer’s Guide, see these sections:
|
In TIBCO BusinessEvents® Extreme Studio Explorer, highlight the project name, then from the top menus select
Project >
          View
. You see the project visualization in the main editor window.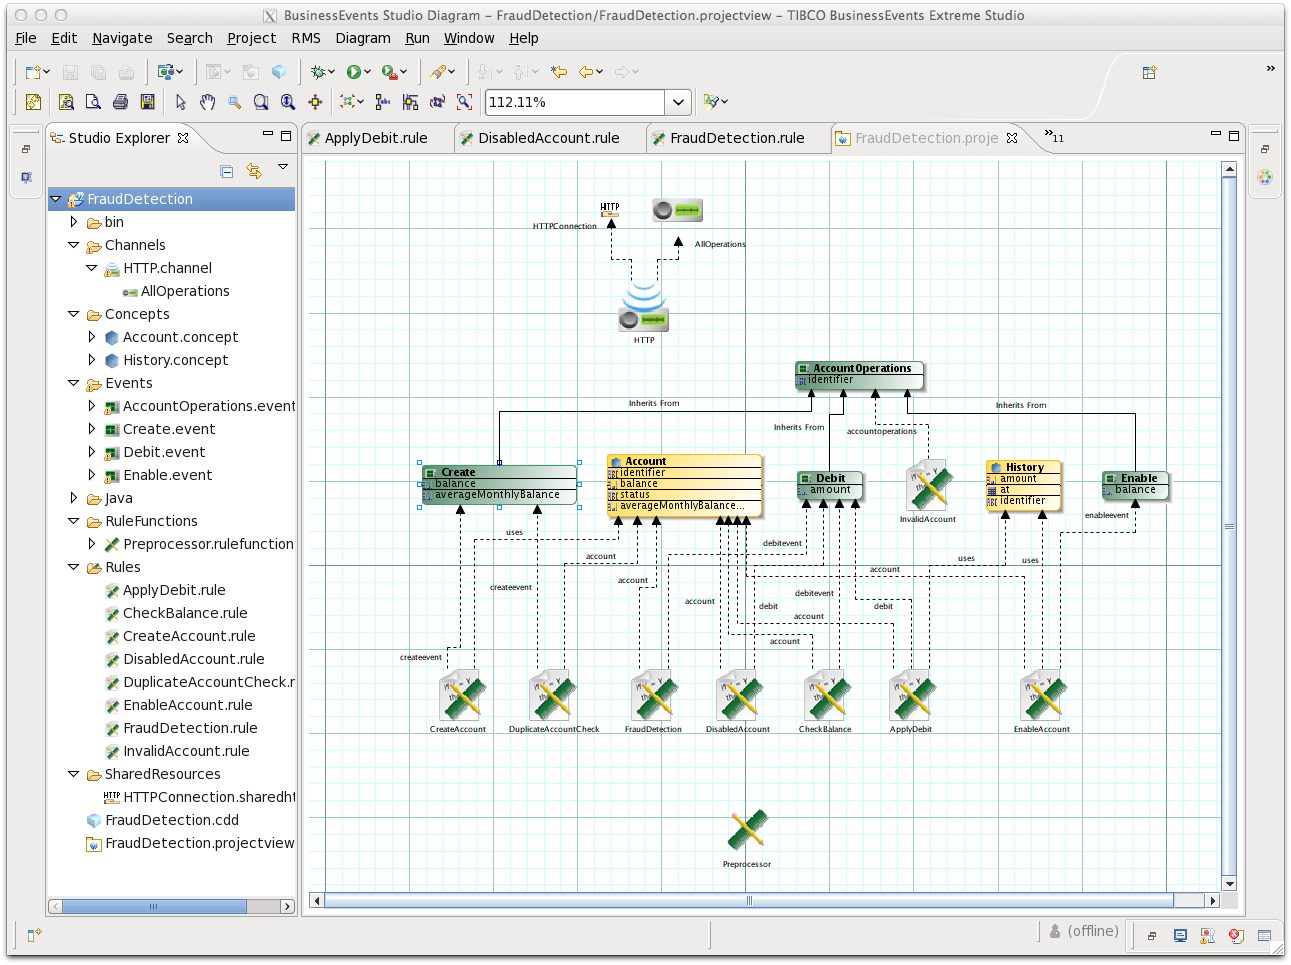
You can see the dependencies and relationships between the project resources. You can jump to a resource editor by clicking the resource’s icon. You can use the Project Filter palette which appears to the right of the diagram to show selected types of items only.
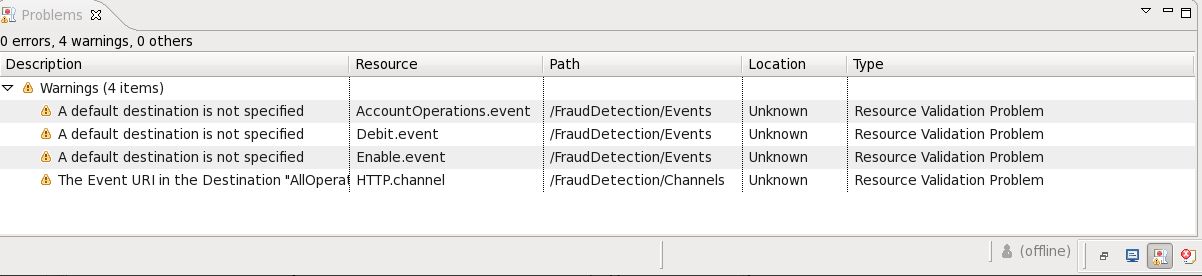
Click the Problems tab to see the project analysis.
The Type columns shows the type of check that resulted in the warning. You can sort by any column. Here are some warnings about actions taken during project development. They are sorted by Resource and some columns are sized smaller to make others more visible.
Close the
FraudDetection.projectviewtab. Diagrams are not saved. They are generated when needed.