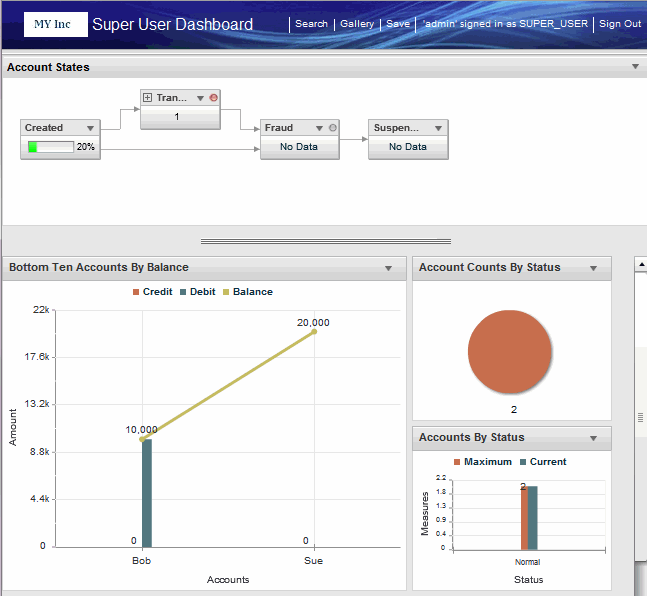
Dashboard Page Option
Dashboard pages consist of panels and partitions that contain various components such as charts that were configured for your use.
Using the command bar at the top of the window you can change roles, open a search page or open a gallery of charts, if these features are configured for your use. If your dashboard is configured with multiple dashboard pages you can switch between them using options on the left (not shown).
State machine components are available only with the TIBCO BusinessEvents Data Modeling add-on.
The dashboard components within a panel are arranged in a sequence from left to right on the top, and then wrapping and continuing on the next row.
You can drag the components to different positions. The order can also change when you resize the browser window, to display the charts optimally.
If your dashboard is configured to display alerts, alert icons may appear, and colors may change to alert you when data value crosses configured threshold. You can also hover the mouse over the alert indicator to see information about the alert.
If your dashboard is configured to allow drill-down, you can click on a data point to drill-down and learn more about the data that caused that marker. For more information on how to use information displayed in the dashboard components, see Data Query and Analysis.

