Enabling Process Monitoring
Process Monitoring can be configured by using the environment variable BW_APP_MONITORING_CONFIG. For more information, see Binding BusinessWorks Application to Monitoring Application on Docker or Binding BusinessWorks Application to Monitoring Application on CF or Binding BusinessWorks Application to Monitoring Application on Kubernetes
To access the process monitoring landing page, go to the
Application Level 2 page, navigate to the
Process
tab, click the
Process Instance icon
 .
.
All the instances, processes and subprocesses of the selected application are displayed on the landing page.
You can begin monitoring your process instances once you enable the Process Monitor button after deploying the application.
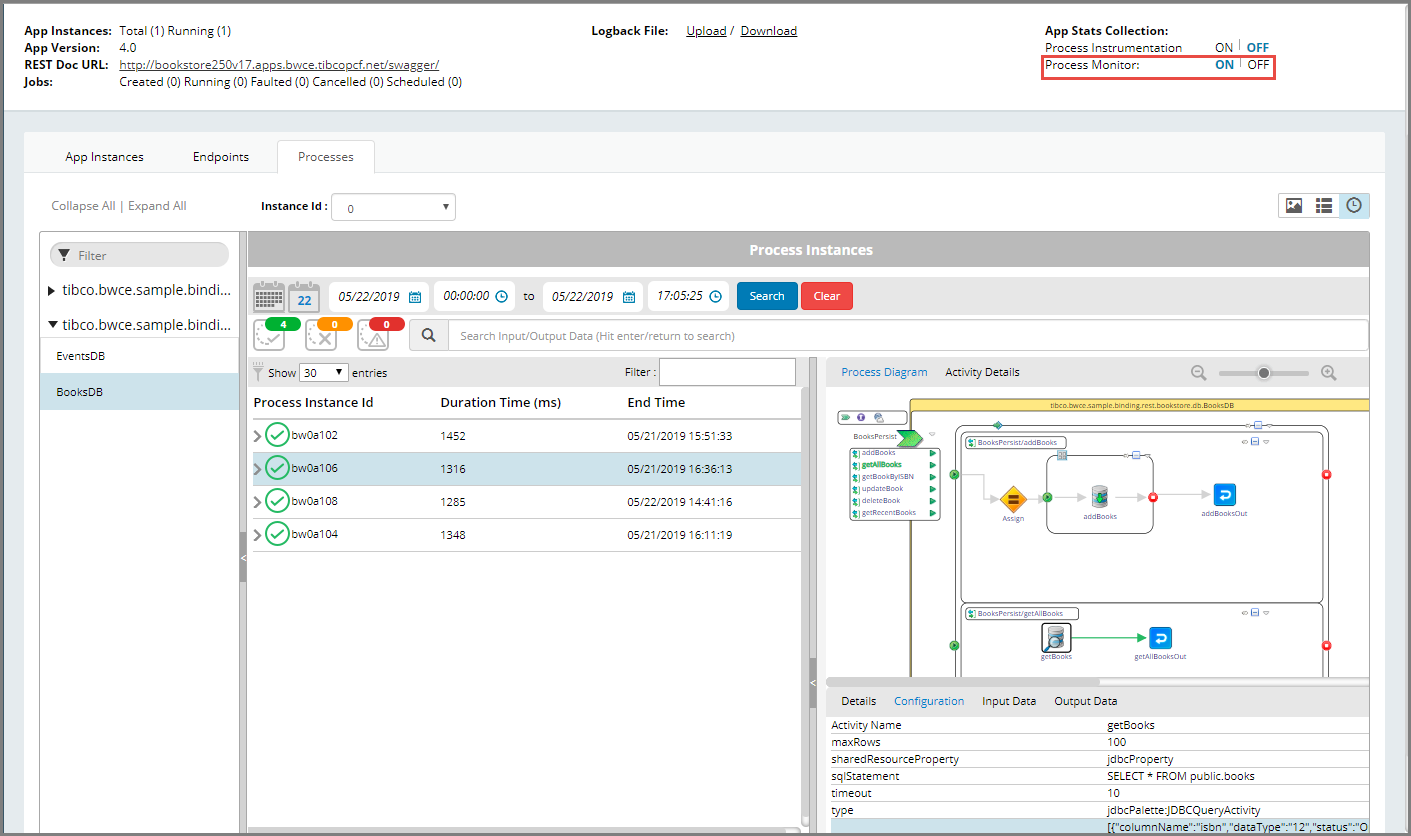
By default, all the instances in the selected process are displayed.
In the above example, click the process Books. Job data releated to the Books process is displayed in a tabular form, and the process diagram of the process is also displayed.
In the Monitoring UI the following details are displayed in the default view.
The columns displayed in the default view can also be customized to display additional information about the process instances. Use the
Select Columns filter
 to add the columns,
StartTime and
EvalTime (ms).
to add the columns,
StartTime and
EvalTime (ms).
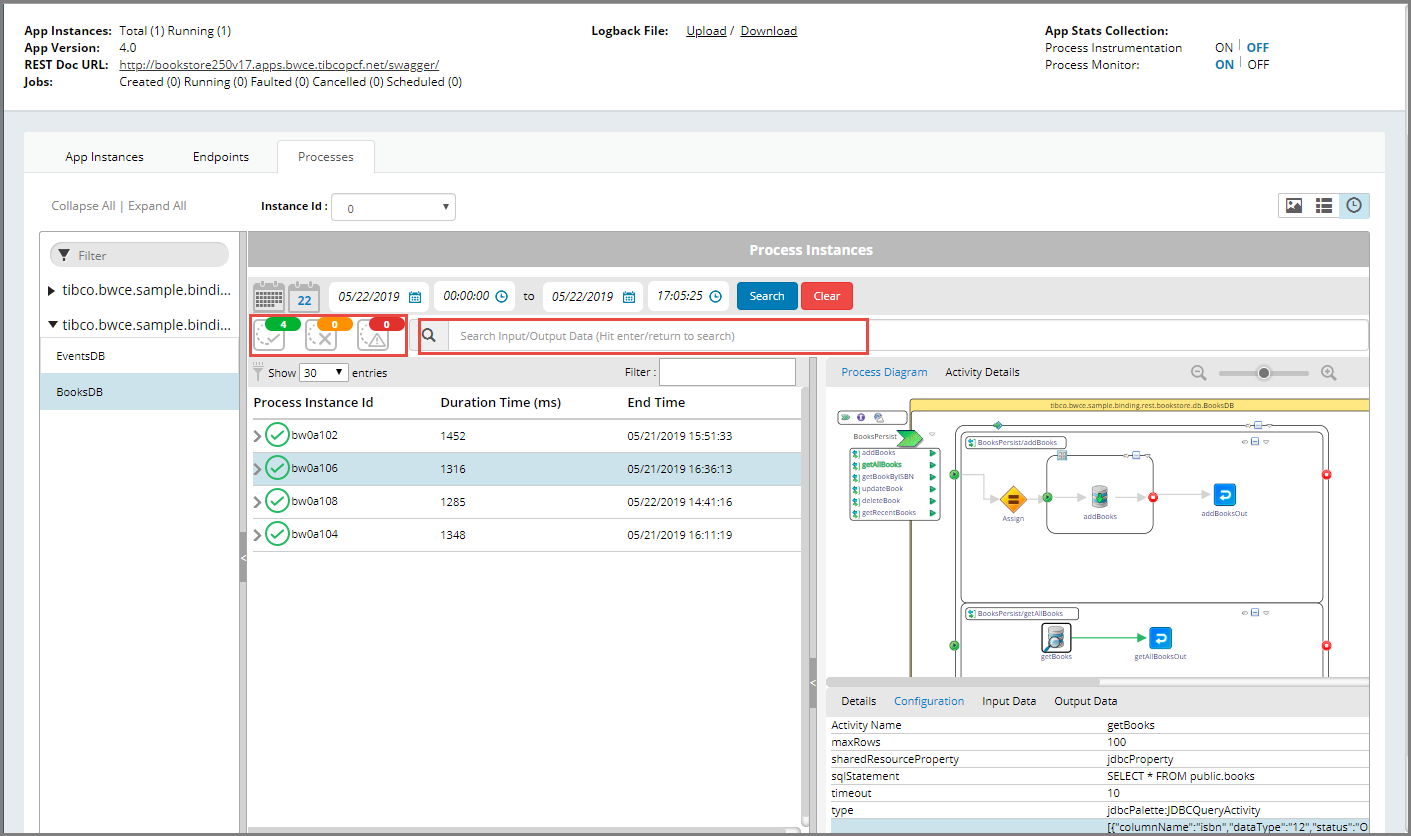
- Job Status filters - Job data can be filtered based on their completion status. Select the
 icon to filter the jobs that were completed. The icon,
 displays only the jobs that were cancelled and
 filters the jobs that faulted.
- Filter - This filter searches through the column for any values provided in this filter text box available on that page.
The process diagram and activity details for each process instance is displayed in the extreme right panel. Click the process instance in the second panel, and the process diagram for that instance is displayed.
The Activity Details tab contains the ActivityName, State, Timestamp, StartTime, DurationTime (ms) and EvalTime (ms) of the particular activity selected.
The State of the selected activity can either be Completed, Faulted or Cancelled. If the activity is in a Cancelled State, the details of only those activities will be displayed before the Cancelled state in the Details tab.
The Details tab, Configuration, Input Data and Output Data tabs contain the configuration, input and output details of the process instance.
- When a process contains multiple constructors, the activities in the constructor are not visible in the Monitoring UI when the constructor is minimized while creating the EAR file. Expand the constructors and regenerate the EAR file to view the activities inside constructors.
- Fix any ActivityID related warnings displayed in Studio , and then create the EAR file to ensure that the Input and Output data is displayed correctly.
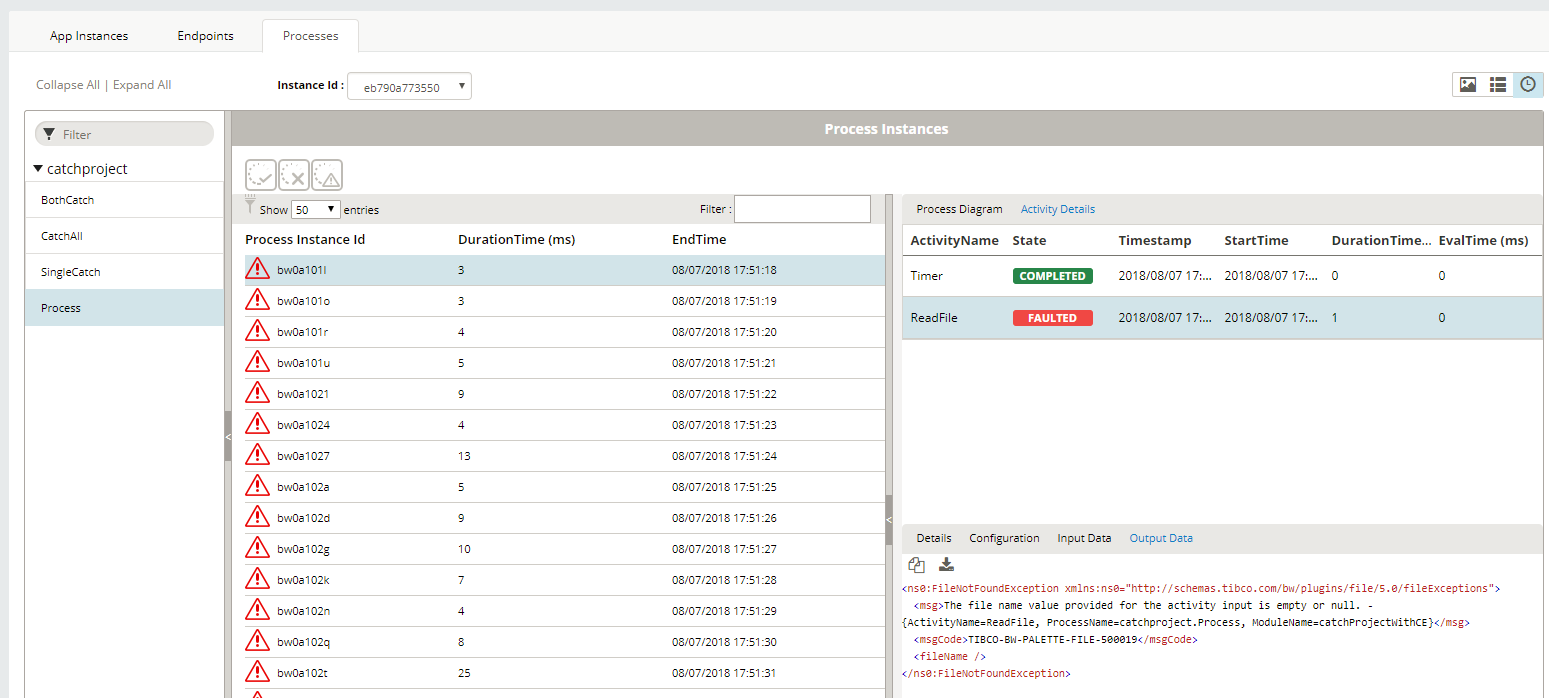
In the image above, the Ouput Data tab displays the error due to which the process faulted.