Debugging the Plug-in
To debug the runtime of your created plug-in:
- Generate the p2 site for your palette. See Generating an Installer
- Install the plug-in on studio. See Installing a Created Plug-in
- You can set breakpoints in your runtime code.
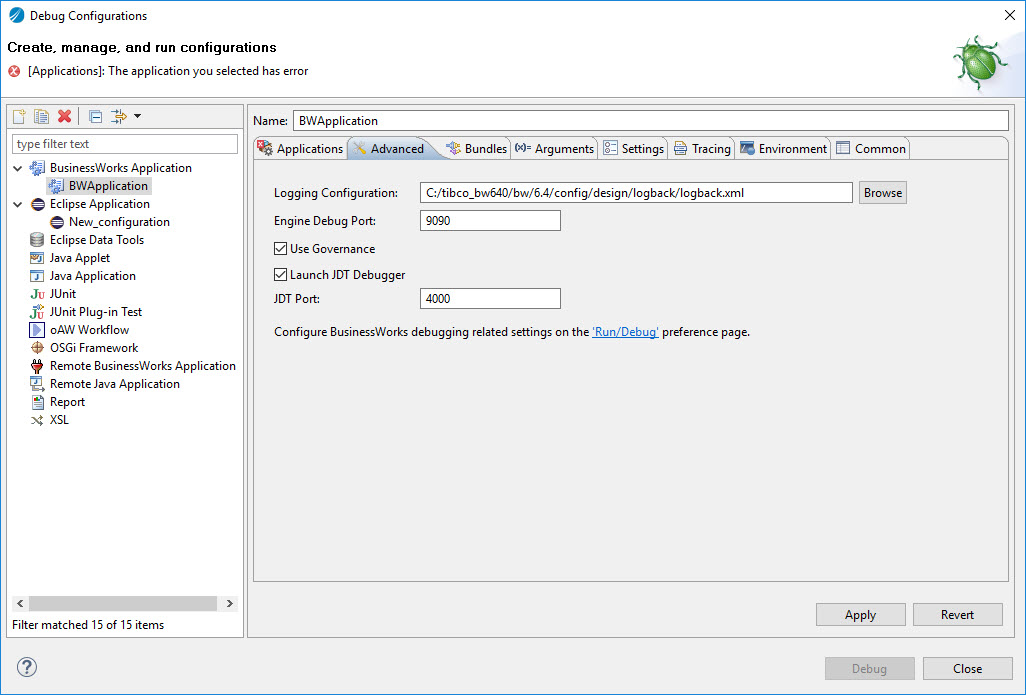
- Click
- In the Create, manage, and run configurations dialog, select BWAplications under BusinessWorks Application.
- In the Advanced tab, select Launch JDT Debugger check box.
- Click Apply.
For more information about how to create a process, see TIBCO ActiveMatrix BusinessWorks Application Deployment.
Copyright © Cloud Software Group, Inc. All rights reserved.