Project Data Page
The sample data of the selected project is displayed on the project data page.
As shown, the project data page is divided into the following five function areas:
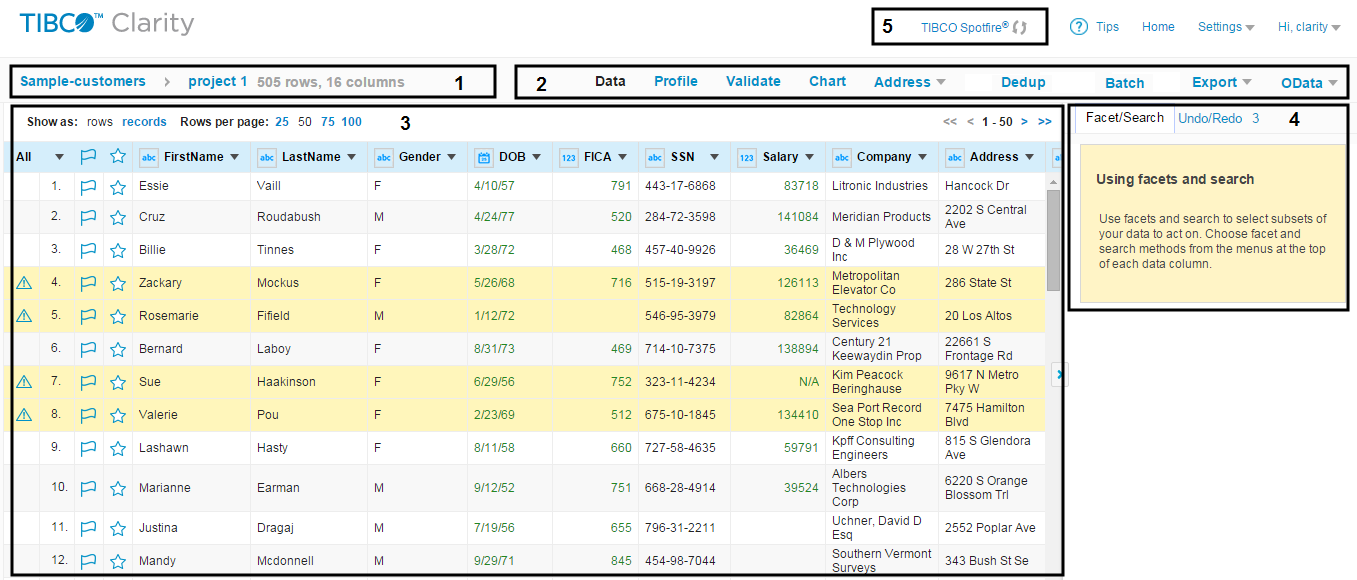
- Project Information
The total number of rows and columns of the selected project is displayed in this area.
Move your mouse pointer over the project name and click Rename to change the project name.
- Toolbar
The buttons corresponding to different functions are displayed, such as Data, Profile, Validate, Chart, Address, Dedup, Batch, Export and OData.
The Data button directs you to the project data page, and the Batch button direct you to the "Dataset summary" page. - Data Table
The first row of the uploaded data is parsed to column headers. By default, the project data is displayed in rows. You can click rows or records to alternate the data view between rows and records. The
 icon next to a row indicates that the corresponding row contains invalid data, and the icon next to each column name indicates the data type of the column. TIBCO Clarity automatically detects and assigns a data type to each column according to the cell content.
The rows can be displayed in one of three colors. Different colors indicate different meaning:
icon next to a row indicates that the corresponding row contains invalid data, and the icon next to each column name indicates the data type of the column. TIBCO Clarity automatically detects and assigns a data type to each column according to the cell content.
The rows can be displayed in one of three colors. Different colors indicate different meaning:- When the rows contain invalid values, they are displayed in yellow. See Validating Data for details.
- When the value of dedup_group = -1 or addr_group = -1, the rows are displayed in orange. See Dedup Results and Address Cleansing Results for details.
- When the value of dedup_group > 0 and dedup_isLead = true, the rows are displayed in green. See Dedup Results for details.
You can also click the flag or the star icon to mark the rows that you want to manage together. See Managing Project Data for details.
Click the
 icon next to each column to manage the corresponding column. See
Manipulating a Column for details.
icon next to each column to manage the corresponding column. See
Manipulating a Column for details.
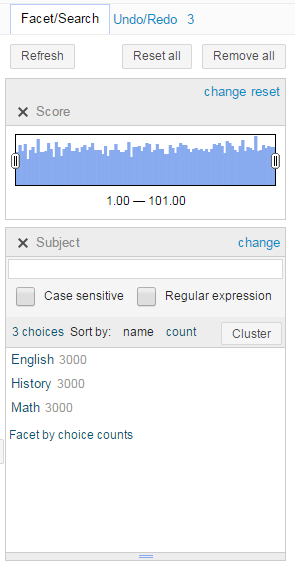
- Facet/Search and Undo/Redo Panel
- The Facet/Search panel list all the facets made to the project data. Facets do not affect the values of your data, but provide you useful insights of your dataset. You can update your project data according to the facet result.
- The
Undo/Redo panel records the operation history of a project. You can cancel an operation by clicking the operation. Click
0. Create project to cancel all modifications and go back to the original status of the project.
Click Extract to extract the selected operation including the preceding operations to a JSON file, and then you can apply the operations extracted to the JSON file to other projects.
- TIBCO Spotfire®


Project Data Page in View Mode
In view mode, the differences on the simplified project data page are as follows:
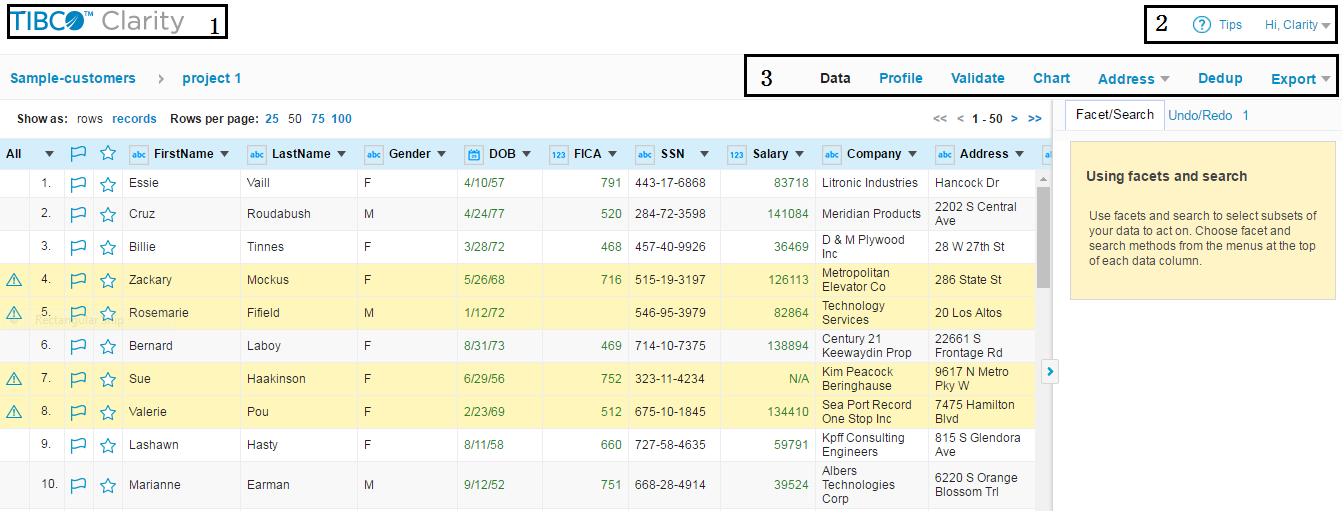
See Launching TIBCO Clarity in View Mode for details about the view mode feature.