Column Analysis Report
When profiling project columns, columns are divided into three types: numeric columns, date and time columns, and string columns.
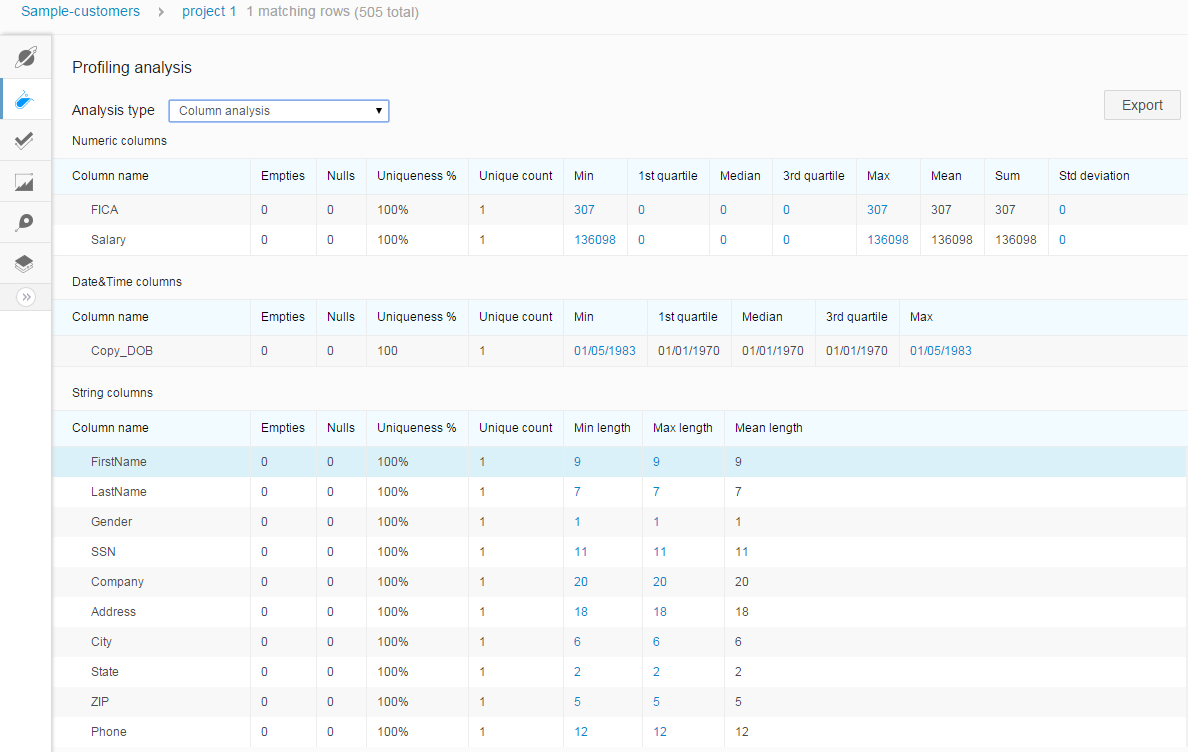
Numeric Column
All the numeric columns are grouped into the Numeric columns table. The table provides you with information regarding amount of empties, nulls, uniqueness, unique count, minimum and maximum cell values, and mean length of your data. You can also click the number links to see the data that matches the analysis criteria.
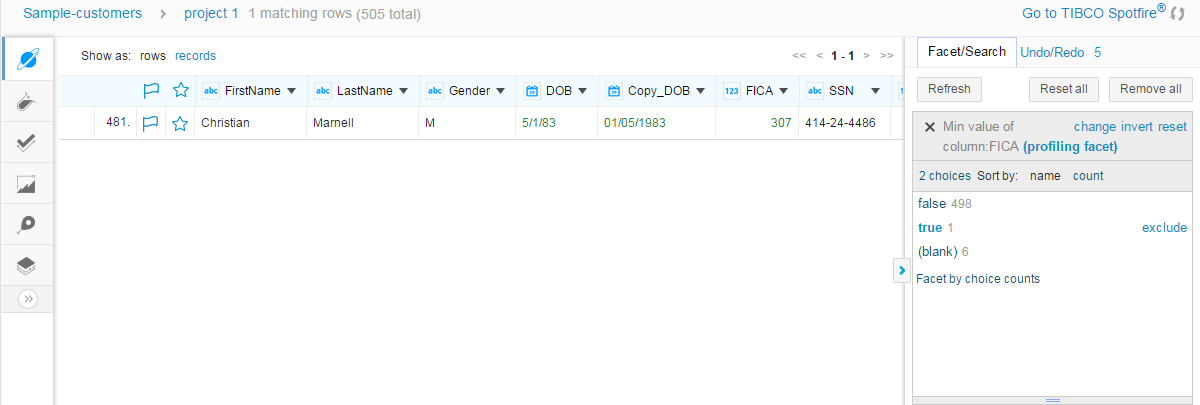
Take the FICA column for example. When you click the 307 link in the Min column, the data rows that contain this minimum value are displayed and the corresponding profiling facet is displayed in the Facet/Filter tab.
Date and Time Columns
All the columns with Date or Time data types are grouped into the Date&Time columns table. This table provides you with information regarding amount of empties, nulls, uniqueness, unique count, minimum, and maximum time. You can click the values in the Min and Max columns to view the data that matches the analysis criteria.
String Columns
All the columns with String data types are grouped into the String columns table. This table provides you with information regarding amount of empties, nulls, uniqueness, unique count, minimum length, maximum length, and mean length of your data.
Take the LastName column for example. There is no empty and null data in this column. The minimum string length is 3, and the maximum length is 13. Additionally, there are 498 unique values in this column. You can also click the values in the Min length and Max length columns to view the data that matches the analysis criteria.