Creating dashboards
A dashboard presents visual feedback from indicators. Each TIBCO EBX® Insight Add-on dashboard can have multiple sections and each section can have multiple indicators. This affords you flexibility in how you group indicators.
Note
Once you create a dashboard and add indicators using the steps outlined below, users can also interact with the indicators via the Execute and query service. For instructions on configuring indicators outside of the dashboard, see Add-on configuration.
To create your first dashboard and add indicators:
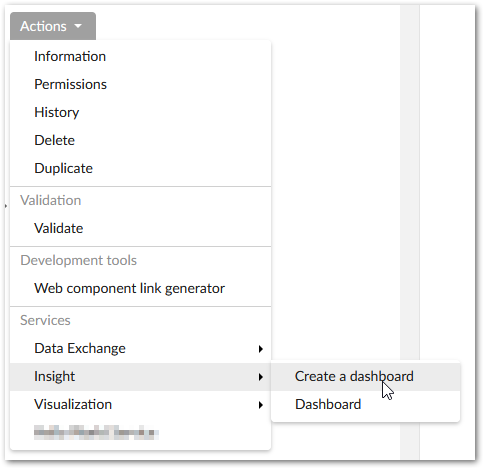
From a dataspace or dataset Actions menu, select Insight > Create a dashboard.
Supply the required information and select Add. The following describes the required fields:
A name for the dashboard. This name displays in the drop-down menu users use to access different dashboards.
Select the dashboard template. If this is the first time you are configuring a dashboard, you can use the default template. Create a new record in the Template table if you want to create a custom template.
Use the Access permission menu to select the profile that can access this dashboard. You can also use the Is default property determine whether this is the default dashboard that displays when accessing from the TIBCO EBX® toolbar.
After creating a dashboard you need to create at least one section in order to add indicators. From the blank dashboard, select the
 icon to add a new section. After it displays next to the all tab, you can double-click to give it a new name.
Select the tile with the large plus icon to add an indicator to this section. On the screen that displays enter the required information and select Add.
The options are described in more detail below:
Indicator: The indicator you want to display on this tile.
D.E.C.: A Data Element Concept (D.E.C.) represents a specific data asset managed by EBX®. Asset types include, but are not limited to, datasets, tables, fields, and workflows. Since indicators only monitor data of a certain type, only certain indicators can be applied to each D.E.C. Use the + icon next to this field to select the desired data to monitor by choosing the type and then pointing to the corresponding data model element.
Available display modes: This option determines the types of charts users can select when viewing the indicator.
Default display mode: This option determines how the indicator displays by default when users access a dashboard.
Tile size: Specifies the indicator tile size.