All release notes
- Version 6.2.3
- Version 6.2.2
- Version 6.2.1
- Version 6.2.0
- Version 6.1.3
- Version 6.1.2
- Version 6.1.1
- Version 6.1.0
- Version 3.1.6
- Version 3.1.5
- Version 3.1.4
- Version 3.1.3
- Version 3.1.2
- Version 3.1.1
- Version 3.1.0
- Version 3.0.1
- Version 3.0.0
- Version 2.7.6
- Version 2.7.5
- Release Note 2.7.4
- Release Notes 2.7.3
- Release Notes 2.7.2
- Release Notes 2.7.1
- Release Notes 2.7.0
- Release Notes 2.6.1
- Release Notes 2.6.0
- Release Notes 2.5.0
- Release Note 2.4.0
- Release Note 2.3.2
- Release Note 2.3.1
- Release Note 2.3.0
- Release Note 2.2.2
- Release Note 2.2.1
- Release Note 2.2.0
- Release Note 2.1.2
- Release Note 2.1.1
- Release Note 2.1.0
- Release Note 2.0.0
- Release Note 1.6.1
- Release Note 1.6.0
- Release Note 1.5.2 fix 001
- Release Note 1.5.2
- Release Note 1.5.1 fix 003
- Release Note 1.5.1 fix 002
- Release Note 1.5.1 fix 001
- Release Note 1.5.1
- Release Note 1.5.0
- Release Note 1.4.3
- Release Note 1.4.2
- Release Note 1.4.1
- Release Note 1.4.0
- Release Note 1.3.6
- Release Note 1.3.5
- Release Note 1.3.4
- Release Note 1.3.3
- Release Note 1.3.2
- Release Note 1.3.1 fix 001
- Release Note 1.3.1
- Release Note 1.3.0 fix 001
- Release Note 1.3.0
- Release Note 1.2.0
- Release Note 1.1.2
- Release Note 1.1.1 fix 001
- Release Note 1.1.1
- Release Note 1.1.0
- Release Note 1.0.1
- Release Note 1.0.0
Version 6.2.3
New features
The add-on was updated to ensure compatibility with TIBCO EBX® 6.2.3 and the Add-ons Bundle 6.2.3.
Changes in Functionality
This release contains no functionality changes.
Changes to third-party libraries
The following third-party libraries were updated:
JFreeChart library was updated to version 1.5.6.
Spring Web MVC was updated to version 6.2.14.
Jackson Core was updated to version 2.21.1.
The Jakarta Servlet version was updated to 6.0.
Closed Issues
This release contains no closed issues.
Known Issues
This release contains the following known issues:
Dashboard export: There are several differences in styles between the charts on browsers and those in the exported files.
Flat data report: Dynamic labels and descriptions are not applied when directly accessing the table in the reporting datasets.
Hierarchy view by data models on the Indicator on D.E.C. table: Orders of data elements may not be the same as in the data models.
The date format used in the calendar and on chart axis annotations behaves as follows:
English: MM/dd/yyyy
French: dd/MM/yyyy
All other locales will follow English.
Version 6.2.2
New features
The add-on was updated to ensure compatibility with TIBCO EBX® 6.2.2 and the Add-ons Bundle 6.2.2.
Changes in Functionality
This release contains no functionality changes.
Changes to third-party libraries
This release contains no changes to third-party libraries.
Closed Issues
This release contains no closed issues.
Known Issues
This release contains the following known issues:
Dashboard export: There are several differences in styles between the charts on browsers and those in the exported files.
Flat data report: Dynamic labels and descriptions are not applied when directly accessing the table in the reporting datasets.
Hierarchy view by data models on the Indicator on D.E.C. table: Orders of data elements may not be the same as in the data models.
The date format used in the calendar and on chart axis annotations behaves as follows:
English: MM/dd/yyyy
French: dd/MM/yyyy
All other locales will follow English.
Version 6.2.1
New features
This release was updated to ensure compatibility with TIBCO EBX® version 6.2.1 and the Add-ons Bundle version 6.2.1.
Changes in Functionality
This release includes no updated functionality.
Changes in third-party libraries
The following third-party libraries were updated:
The Spring framework was updated to version 6.1.15.
The Apache Commons IO library was updated to version 2.18.0.
Closed Issues
This release includes no closed issues.
Known Issues
This release contains the following known issues:
Dashboard export: There are several differences in styles between the charts on browsers and those in the exported files.
Flat data report: Dynamic labels and descriptions are not applied when directly accessing the table in the reporting datasets.
Hierarchy view by data models on the Indicator on D.E.C. table: Orders of data elements may not be the same as in the data models.
The date format used in the calendar and on chart axis annotations behaves as follows:
English: MM/dd/yyyy
French: dd/MM/yyyy
All other locales will follow English.
Version 6.2.0
New features
This release was updated to ensure compatibility with TIBCO EBX® version 6.2.0 and the Add-ons Bundle version 6.2.0.
Changes in Functionality
This release includes no updated functionality.
Changes in third-party libraries
This release contains the following third-party library updates:
Angular was upgraded to version 15.
Spring Web MVC was updated to version 6.1.8.
Closed Issues
This release includes no closed issues.
Known Issues
This release contains the following known issues:
Dashboard export: There are several differences in styles between the charts on browsers and those in the exported files.
Flat data report: Dynamic labels and descriptions are not applied when directly accessing the table in the reporting datasets.
Hierarchy view by data models on the Indicator on D.E.C. table: Orders of data elements may not be the same as in the data models.
The date format used in the calendar and on chart axis annotations behaves as follows:
English: MM/dd/yyyy
French: dd/MM/yyyy
All other locales will follow English.
Version 6.1.3
New features
This release was updated to ensure compatibility with TIBCO EBX® version 6.1.3 and the Add-ons Bundle version 6.1.3.
Changes in Functionality
This release includes no updated functionality.
Changes in third-party libraries
The Spring framework was updated to version 5.3.29.
Closed Issues
This release contains the following closed issues:
[DQID-3616] An error occurs when exporting a PDF file. The chart name of the D-I03, W-I05, T-I16, and F-I22 indicators are exported incorrectly.
[DQID-3617] An error occurs when exporting a PDF file. The sparkline chart of the D-I10, W-I05, W-I04, and F-I32 indicators are not displayed.
[DQID-3621] In the Dashboard, the pie chart of W-I05 indicator is not displayed.
[DQID-3622] Indicator D-I09's line chart timing is not exported correctly in the PDF file.
Known Issues
This release contains the following known issues:
Dashboard export: There are several differences in styles between the charts on browsers and those in the exported files.
Flat data report: Dynamic labels and descriptions are not applied when directly accessing the table in the reporting datasets.
Hierarchy view by data models on the Indicator on D.E.C. table: Orders of data elements may not be the same as in the data models.
The date format used in the calendar and on chart axis annotations behaves as follows:
English: MM/dd/yyyy
French: dd/MM/yyyy
All other locales will follow English.
Version 6.1.2
New features
This release contains no new features.
Changes in Functionality
This release includes no updated functionality.
Changes in third-party libraries
The following third-party libraries were updated:
The FasterXML jackson-databind library was updated to version 2.15.2.
The Batik All library was updated to version 1.17.
Closed Issues
This release contains the following closed issues:
[DQID-3556] The Dynamic report service cannot generate results when Periodicity of control is set to Any.
[DQID-3569] The Acceptance percent and Rejection percent in the exported file are incorrect.
[DQID-3570] The Lifetime of dataspace field is formatting is not preserved when exporting.
[DQID-3572] In the Tile preference table it is possible to select a foreign key that points to an invalid/incomplete indicator.
Known Issues
This release contains the following known issues:
Dashboard export: There are several differences in styles between the charts on browsers and those in the exported files.
Flat data report: Dynamic labels and descriptions are not applied when directly accessing the table in the reporting datasets.
Hierarchy view by data models on the Indicator on D.E.C. table: Orders of data elements may not be the same as in the data models.
The date format used in the calendar and on chart axis annotations behaves as follows:
English: MM/dd/yyyy
French: dd/MM/yyyy
All other locales will follow English.
Version 6.1.1
New features
This release contains no new features.
Changes in Functionality
This release includes no updated functionality.
Changes in third-party libraries
This release contains the following changes to third-party libraries:
The JQuery library was updated to version 3.6.4.
The Spring framework was updated to version 5.2.24.
Closed Issues
This release contains the following closed issues:
[DQID-3540] The Interval format displays incorrectly when executing an indicator on the Dynamic report.
[DQID-3530] An exception is displayed when querying indicators.
Known Issues
This release contains the following known issues:
Dashboard export: There are several differences in styles between the charts on browsers and those in the exported files.
Flat data report: Dynamic labels and descriptions are not applied when directly accessing the table in the reporting datasets.
Hierarchy view by data models on the Indicator on D.E.C. table: Orders of data elements may not be the same as in the data models.
The date format used in the calendar and on chart axis annotations behaves as follows:
English: MM/dd/yyyy
French: dd/MM/yyyy
All other locales will follow English.
Version 6.1.0
Released: March 2023
New features
This release was updated to ensure compatibility with the new way that TIBCO EBX® handles URL encoding. See the EBX® documentation for more details.
Changes in Functionality
This release includes no updated functionality.
Changes in third-party libraries
The Xalan library was removed.
Closed Issues
This release contains the following closed issues:
[DQID-3483] The result page is not displayed when running the Check configuration service.
[DQID-3485] A vulnerability was addressed.
[DQID-3487] An HTML block displays instead rendering the user service screen.
Known Issues
This release contains the following known issues:
Dashboard export: There are several differences in styles between the charts on browsers and those in the exported files.
Flat data report: Dynamic labels and descriptions are not applied when directly accessing the table in the reporting datasets.
Hierarchy view by data models on the Indicator on D.E.C. table: Orders of data elements may not be the same as in the data models.
The date format used in the calendar and on chart axis annotations behaves as follows:
English: MM/dd/yyyy
French: dd/MM/yyyy
All other locales will follow English.
Version 3.1.6
Released: September 2022
New features
This release contains no new features.
Changes in Functionality
This release includes no updated functionality.
Changes in third-party libraries
This release contains the following changes to third-party libraries:
The Apache Taglibs library was removed from this release.
The Apache Batik library was updated to version 1.15.
Closed Issues
This release contains no closed issues.
Known Issues
This release contains the following known issues:
Dashboard export: There are several differences in styles between the charts on browsers and those in the exported files.
Flat data report: Dynamic labels and descriptions are not applied when directly accessing the table in the reporting datasets.
Hierarchy view by data models on the Indicator on D.E.C. table: Orders of data elements may not be the same as in the data models.
The date format used in the calendar and on chart axis annotations behaves as follows:
English: MM/dd/yyyy
French: dd/MM/yyyy
All other locales will follow English.
Version 3.1.5
Released: May 2022
New features
This release contains no new features.
Changes in Functionality
This release includes no updated functionality.
Changes in third-party libraries
The Spring framework was updated to version 5.2.22.
Closed Issues
This release contains no closed issues.
Known Issues
This release contains the following known issues:
Dashboard export: There are several differences in styles between the charts on browsers and those in the exported files.
Flat data report: Dynamic labels and descriptions are not applied when directly accessing the table in the reporting datasets.
Hierarchy view by data models on the Indicator on D.E.C. table: Orders of data elements may not be the same as in the data models.
The date format used in the calendar and on chart axis annotations behaves as follows:
English: MM/dd/yyyy
French: dd/MM/yyyy
All other locales will follow English.
Version 3.1.4
Released: April 2022
New features
This release contains no new features.
Changes in Functionality
This release includes no updated functionality.
Changes in third-party libraries
The Spring framework was updated to version 5.2.20.
Closed Issues
This release contains no closed issues.
Known Issues
This release contains the following known issues:
Dashboard export: There are several differences in styles between the charts on browsers and those in the exported files.
Flat data report: Dynamic labels and descriptions are not applied when directly accessing the table in the reporting datasets.
Hierarchy view by data models on the Indicator on D.E.C. table: Orders of data elements may not be the same as in the data models.
The date format used in the calendar and on chart axis annotations behaves as follows:
English: MM/dd/yyyy
French: dd/MM/yyyy
All other locales will follow English.
Version 3.1.3
Released: March 2022
New features
This release contains no new features.
Changes in Functionality
This release includes no updated functionality.
Changes in third-party libraries
This release contains the following changes to third-party libraries:
The jQuery library was updated to version 3.6.0.
The Spring framework was updated to version 5.2.19.
The FasterXML/jackson-databind library was updated to version 2.13.2.1.
The Apache Xerces library was updated to version 2.12.2.
The Apache XML Graphics Commons library was updated to version 2.7.
Closed Issues
This release contains the following closed issues:
[DQID-3430] A
StackOverFlowErroroccurs when executing the WI04 indicator.[DQID-3442] The graph does not show every subworkflow.
[DQID-3443] Exporting the dashboard to a PDF causes an error.
Known Issues
This release contains the following known issues:
Dashboard export: There are several differences in styles between the charts on browsers and those in the exported files.
Flat data report: Dynamic labels and descriptions are not applied when directly accessing the table in the reporting datasets.
Hierarchy view by data models on the Indicator on D.E.C. table: Orders of data elements may not be the same as in the data models.
The date format used in the calendar and on chart axis annotations behaves as follows:
English: MM/dd/yyyy
French: dd/MM/yyyy
All other locales will follow English.
Version 3.1.2
Released: December 2021
New features
The add-on was updated to ensure compatibility with the latest TIBCO EBX® release (v6.0.4).
Changes in Functionality
This release includes no updated functionality.
Changes in third-party libraries
The following third-party library was updated: jQuery UI to version 1.13.0.
Closed Issues
This release contains the following closed issues:
[DQID-3413] Validate content when running the Dashboard configure service.
[DQID-3414] Validate record content when opened from an indicator, the D.E.C. table, or the Correlated watchdog tab.
Known Issues
This release contains the following known issues:
Dashboard export: There are several differences in styles between the charts on browsers and those in the exported files.
Flat data report: Dynamic labels and descriptions are not applied when directly accessing the table in the reporting datasets.
Hierarchy view by data models on the Indicator on D.E.C. table: Orders of data elements may not be the same as in the data models.
The date format used in the calendar and on chart axis annotations behaves as follows:
English: MM/dd/yyyy
French: dd/MM/yyyy
All other locales will follow English.
Version 3.1.1
Released: November 2021
New features
The add-on was updated to ensure compatibility with the latest TIBCO EBX® release (v6.0.3).
Changes in Functionality
This release includes no updated functionality.
Changes in third-party libraries
The Jackson Databind library was upgraded to version 2.13.2.
Closed Issues
This release includes no closed issues.
Known Issues
This release contains the following known issues:
Dashboard export: There are several differences in styles between the charts on browsers and those in the exported files.
Flat data report: Dynamic labels and descriptions are not applied when directly accessing the table in the reporting datasets.
Hierarchy view by data models on the Indicator on D.E.C. table: Orders of data elements may not be the same as in the data models.
The date format used in the calendar and on chart axis annotations behaves as follows:
English: MM/dd/yyyy
French: dd/MM/yyyy
All other locales will follow English.
Version 3.1.0
Released: July 2021
New features
The behavior of the Maximum number of groups option was updated for grouped results. Now, the number specified by this property determines the number of groups that are computed and the number of groups that display in the indicator.
Changes in Functionality
This release includes no updated functionality.
Changes in third-party libraries
Spring was updated to version 5.2.15.
Closed Issues
This release includes no closed issues.
Known Issues
This release contains the following known issues:
Dashboard export: There are several differences in styles between the charts on browsers and those in the exported files.
Flat data report: Dynamic labels and descriptions are not applied when directly accessing the table in the reporting datasets.
Hierarchy view by data models on the Indicator on D.E.C. table: Orders of data elements may not be the same as in the data models.
The date format used in the calendar and on chart axis annotations behaves as follows:
English: MM/dd/yyyy
French: dd/MM/yyyy
All other locales will follow English.
Version 3.0.1
Released: June 2021
Product updates
The following library updates were made in this release:
The Apache Batik library was updated to version 1.14.
The Apache Commons-io library was updated to version 2.8.0.
Version 3.0.0
Released: February 2021
Product updates
This version of the add-on was updated to ensure compatibility with TIBCO EBX® 6.0.0 GA release.
The add-on now exposes tables by declaring replication units in its reporting data model. This allows indicators to be queried using SQL and expose the results to other applications.
When a dashboard is opened from a dataspace, options are now hidden for types of indicators that do not apply to dataspaces.
The add-on's reporting data model was adapted to use the EBX® semantic mode.
The following tables will no longer be available to third-party tools used to query the add-on's reporting tables:
Watchdog indicator report
Watchdog indicator report - Flat data report
Correlated watchdog indicator report
Correlated watchdog indicator report - Watchdog indicator report
Bug fixes
This release includes the following bug fixes:
[DQID-3254] The period of bar chart is not followed the Periodicity of control field on the Indicator on D.E.C. table.
[DQID-3235] The dashboard Configuration screen is missing the Input parameters field and Grouping options tab.
[DQID-3203] The section name is incorrectly displayed on the Remove section pop-up when it contains an HTML tag.
[DQID-3209] The Linked records fields are missing in files exported using the TIBCO EBX® Data Exchange Add-on services.
[DQID-3215] 'No records found.' is displayed when users execute indicators on the second dataset published from the same data model.
[DQID-3217] [F-I19] Inconsistent results between Execute(on demand mode) and Query(re-time mode) after running the indicator F-I19.
[DQID-3220] The input parameter Chart display mode of D-I03 is not working on Dashboard/Indicator configuration.
[DQID-3227] Time slice periodicity list of Tile preference is displayed with a redundant Hourly periodicity.
[DQID-3228] Unexpected behavior occurs when displaying dashboards on workflows after users enters the Target dashboard.
[DQID-3230] The Field value completeness indicator provides incorrect charts when users define the Maximum number of groups option.
[DQID-3234] [F-I31] The charts on tiles do not follow the Default output parameters field setting.
[DQID-3237] The pop up 'Cannot access the service' is displayed when users view charts on small/big tiles.
[DQID-3243] The Dashboard service displays under the result table when executing and querying indicators.
[DQID-3244] Some values are missing on the Periodicity of control drop down list in the dashboard Configuration screen.
[DQID-3283] [F-I20, F-I31] A Sparkline chart should be hidden in an exported PDF file.
[DQID-3286] [Chart API] Barchart and CategoryBarChart are not displayed on Internet Explorer 11.
[DQID-3287] [Chart API] Piechart, Linechart and Sparkline charts display the tooltip in the wrong place on Internet Explorer 11.
[DQID-3288] [Chart API] All fields on Chart option of Barchart should have a default value.
[DQID-3289] [Chart API] The legend displays incorrectly when the real legend size is greater than the legend size settings.
[DQID-3298] [IE] The Add tile button on a global dashboard displays incorrectly.
[DQID-3301] The synthesis result is not displayed when users execute/query an indicator.
[DQID-3278] The text 'Big data report table' should be hidden on the message when users run the Purge indicators service.
[DQID-3284] [IE] The execution date is duplicated on the tooltip of Line and Sparkline charts.
[DQID-3292] [IE] The date time is duplicated on OY axis of Line charts.
Version 2.7.6
Released: February 2021
Bug fixes
This release contains the following bug fixes:
[DQID-3361] The date format displayed in dashboards is incorrect.
[DQID-3362] The French translation of "grouped by" was updated.
Version 2.7.5
Released: January 2021
Featured updates
This release contains the following library updates:
Apache Standard Taglibs library to version 1.2.3.
Spring framework library to version 5.2.9.
Jackson Databind library to version 2.11.2.
Dashboard export templates can no longer include Document Type Definition (DTD) declarations. The add-on will throw an error if this element type is included in a template.
Release Note 2.7.4
Release Date: September 18, 2020
Featured update
The add-on has been updated to support the OpenJDK8 and OpenJDK11 libraries.
Libraries were updated to fix some potential issues.
Bug fixes
This release contains the following bug fixes:
[DQID-3321] Some JAXB libraries need adding to support JDK11.
[DQID-3324] CLONE - [JDK8][F-I31] The chart on the dynamic report screen is displayed incorrectly.
Release Notes 2.7.3
Release Date: June 23, 2020
Product updates
This release includes an updated version of the jQuery library (version 3.4.0).
Bug fixes
This release includes the following bug fixes:
[DQID-3263] CLONE - [F-I31] A bar chart from a group is not exported correctly in a PDF file.
[DQID-3264] CLONE - The chart title is not aligned on Dynamic report result when not focusing on the chart.
[DQID-3265] CLONE - The sparkline chart is not displayed on a dashboard tile.
[DQID-3266] CLONE - The grouping bar chart is displayed in a user-unfriendly manner on the dashboard and the Query screen.
[DQID-3267] CLONE - The periodicity of line and bar charts on a full tile is incorrect when users apply a scroll period.
[DQID-3268] CLONE - [Purge indicators] Incorrect results are returned on the Indicator and D.E.C. fields when executing the Purge indicators service.
[DQID-3269] CLONE - Incorrect result are returned after executing the F-I39 indicator with the Count white spaces as 1 size field set to No.
[DQID-3270] CLONE - The F-I40 indicator returns inconsistent results between the Overview and detail result tabs.
[DQID-3271] CLONE - It is not possible to filter invalid records on the D.E.C. table.
[DQID-3272] CLONE - An error is displayed after users select a workflow indicator on the Dynamic report page.
[DQID-3273] CLONE - The Export to PDF button is missing after creating a new tile on a dashboard.
[DQID-3274] CLONE - [Query] D.E.C.s cannot be filtered on the Filtering by D.E.C. pane when there is one indicator attached to D.E.C.s in another dataspace.
[DQID-3275] CLONE - [F-I20] The linked record is displayed incorrectly on a bar chart that uses grouping.
[DQID-3276] CLONE - An error occurs in the UI when running the Purge indicators service.
[DQID-3277] CLONE - A value is duplicated on the Y axis of line and bar charts when displayed in a small tile.
[DQID-3282] An add-on description in French is not translated.
Release Notes 2.7.2
Release Date: April 20, 2020
Bug fixes
This release includes the following bug fixes:
[DQID-3222] A
NullPointerExceptionoccurs when the grouping function of an indicator is used.[DQID-3260] [Dashboard] The Input parameters field and the Grouping options tab are not available in the Configuration screen.
[DQID-3261] [Dashboard] There are a redundant date picker and a zoom option on the full size chart tile.
Release Notes 2.7.1
Release Date: January 15, 2020
Product updates
The TIBCO EBX® Insight Add-on no longer ships with certain third-party Limited General Public License (LGPL) libraries. You must re-package the add-on before you can successfully deploy it. The add-on bundle includes a script to automate this process. Please see the TIBCO EBX® Add-ons Versioning and Packaging Guide for detailed instructions. You can find this guide in the PDF documents included with your add-on bundle, or on https://docs.tibco.com under the page dedicated to the TIBCO EBX® 4.3.2 Add-ons Bundle.
Bug fixes
This release includes the following bug fixes:
[DQID-291] A user un-friendly message is displayed after deleting indicators in a section.
[DQID-330] [Dashboard] The message [Empty value] displays after users add a new indicator using the Dashboard UI.
[DQID-563] [F-I19] Inconsistent result between Execute (on demand mode) and Query (re-time mode) after running the indicator F-I19.
[DQID-569] [LAYOUT][Dashboard] The order of tiles are different after enabling Different tiles by group.
[DQID-828] [ChartAPI] Category bar chart display overlaps when the 'stack' value is No.
[DQID-848] [Integrated 5.9.0] The grouping bar chart is displayed incorrectly on small/big/full tile on dashboard.
[DQID-906] [Integrated 5.9.0] [Dashboard] The field 'Separate tiles by group' is hidden on the 'Add new section' popup.
[DQID-1289] [Dynamic report] Users can still execute an indicator without defining 'Maximum Threshold field'.
[DQID-1416] The information related to the Big data report table should be hidden for the 'D.E.C. purge' service.
[DQID-1577] [Dynamic report ] [F-I05,F-I19, F-I20, F-I23, T-I15] No error message displays when users enter an invalid value.
[DQID-2878] [S6] Periodicity of control displays incorrectly on line charts.
[DQID-2958] [Synthesis view]A new ebx window displays inside when clicking on Synthesis view during a purge indicator in progress.
[DQID-2992] [Export PDF file][W-I04] the Digital mode displays on the exported file even though it was not displayed on the dashboard.
[DQID-3006] Incorrect display of special characters on the 'Filtering by D.E.C' box.
[DQID-3036] The digital tiles display inconsistently between the dashboard and the exported PDF file.
[DQID-3195] The sparkline chart displays an empty tooltip on the Analytics view when enabling grouping the indicator.
[DQID-3197] [F-I20, F-I31] The sparkline chart displays incorrectly on the Dashboard when enabling grouping the indicator.
Release Notes 2.7.0
Release Date: November 8, 2019
New features and updates
This release includes the following new features and updates:
Dashboard features
The following features have been added and updated for add-on dashboards:
Administrators can now create a dashboard from dataset or dataspace Actions menu. Additionally, dashboard configuration settings can be edited directly when viewing a dashboard.
Administrators can edit indicator configurations using a new option on dashboard tiles without having to navigate to the EBX® Administration area.
Previously, dashboards were required to have content. To support above features, dashboard sections can now be left blank.
When refreshing the dashboard view, the dashboard no longer redirects you to the All tab. Instead, it remains on the current tab.
The dashboard refresh icon has been updated so as to differentiate its functionality from refreshing the display vs re-executing indicators.
You now only have to double-click a section name to edit it.
You now can enable access to the Global dashboard on perspectives. This allows users to select from multiple dashboards.
Additional updates and enhancements
The following lists additional updates and enhancements included in this release:
How bar charts compute and display values has been updated. Indicator computation values for each bar now take into account the periodicity of control. This means that when users change the displayed periodicity the displayed value changes accordingly.
The full number up to 9 digits is displayed in the indicator tile. In case the number has more than 9 digits ( up to 15 digits), the number displays using scientific notation format. For example, the number 1234567890 will be displayed as 1.2346E+9.
Pie chart tooltips now show the percentage and data value that correspond to the selected slice.
Email notifications can now be sent to groups of users included in the same role.
The Label field has been removed from the Tile layout in dashboard and Indicator in section tables.
Bug fixes
[DQID-252] [Pie chart] Some charts are not shown when viewing an indicator on multiple D.E.C.s with the Only last measure option activated.
[DQID-257] [Email] Filter predicate is not shown in the content of an email.
[DQID-412] [Query Indicator] The Clear field button should be active when users enter date and time manually.
[DQID-416] [Dashboard] The previous value is not shown on the digital mode of an indicator that does not support grouping.
[DQID-428] [Chart API] The x-axis annotation is not fully displayed if it has many characters.
[DQID-500] The list of D.E.C. types is not displayed on the Data element search filters of the D.E.C. table.
[DQID-2853] [S5] A chart is displayed in different ways between the dashboard and the exported file.
[DQID-2854] [Watchdog] The Threshold defined at indicator's level field value is not set when changing the indicator.
[DQID-2961] [All browsers] The borders of the Add, Remove buttons in the Purge indicators service overlap.
[DQID-2994] [Export PDF file][W-I04] All charts except for bar-charts are displayed on the exported file.
[DQID-3004] A text overflow occurs on the Overview table when executing D-I01.
[DQID-3032] An exception occurs when executing the F-I44 indicator if the D.E.C. field has greater than 15 digits.
[DQID-3047] The date time display on the PDF file is wrong.
[DQID-3060] [Chart API] The line chart disappears on Chart API when the data type of Y is set to boolean.
[DQID-3062] [Chart API] A part of pie chart is hidden when a slice is highlighted.
[DQID-3064] CLONE - [Chart API] The slice of the first pie chart is highlighted when clicking on the slice of the second pie chart.
[DQID-3067] [Chart API] A bar chart does not have enough space for Year when the X axis data type is Date.
[DQID-3068] [Chart API] A stacked bar chart has an exceedingly long Y axis.
[DQID-3071] [Chart API] A customized template is not applied on a chart.
[DQID-3072] CLONE - [Chart API] The slide does not return to the original position after being clicked on.
[DQID-3077] [Chart API] A redundant space and a weird vertical scroll appear when the real legend height is greater than the legend height of the Chart table.
[DQID-3080] CLONE - [Chart API] Labels and bars are not in the same location on the X-axis when users change the bar-width.
[DQID-3081] CLONE - [Chart API] Tooltip description does not correspond to the actual behavior of charts.
[DQID-3082] CLONE - [Chart API] The
CategoryBarChartdisplays incorrectly when the number is greater than 10.[DQID-3083] CLONE - [Chart API] The bar width of a category bar chart is not displayed as being configured.
[DQID-3084] CLONE - [Chart API] The values on bar charts are wrong in stack mode.
[DQID-3085] CLONE - The tooltips are too far away from of their corresponding columns on a barchart.
[DQID-3089] CLONE - [S6][Chart API] The format of numbers on chart API is not following the EBX® locale.
[DQID-3125] Chart display is incorrect when the maximum number of group is set to 0.
[DQID-3135] [Execute-Query] When executing an indicator in a dataspace, the same indicator on another data space is also executed.
[DQID-3137] A tile cannot be added on the Dashboard for an indicator that has the grouping function.
[DQID-3150] [Purge indicators] No matched records are found when executing the Purge indicators service on a record with a specified date-time.
[DQID-3152] [Purge indicators] Incorrect results are returned on the Indicator and D.E.C. fields when executing the Purge indicators service on a D.E.C.
[DQID-3162] The barchart of F-I20 is displayed incorrectly without grouping.
[DQID-3170] [Chart API] The line chart is displays in a user-unfriendly manner when users enter a value from 4 to 14.
Release Notes 2.6.1
Release Date: August 2, 2019
Bug fixes
[DQID-2868] [S6][Chart API] The Chart API number formatting does not follow the EBX® locale conventions.
[DQID-3010] [Chart API] The margins (Top - Left) in the div of the chart cannot be overridden or removed.
[DQID-3012] [Chart API] A redundant scroll bar displays.
[DQID-3026] [Chart API] When using the Chart API, charts can overlap and overflow.
[DQID-3041] Tooltips display too far away from their corresponding columns on bar charts.
[DQID-3046] The legend box is not wrapped in the charts when the legend position is SouthEast or SouthWest.
[DQID-3048] [Chart API] A slice of the first pie chart is automatically highlighted when clicking on the slice of the second pie chart.
[DQID-3050] [Chart API] The legend overlaps the chart when the legend position is NorthWest.
[DQID-3052] [Chart API] The values of a bar chart are wrong when the chart is displayed in stack mode.
[DQID-3053] [Chart API] The actual bar width is wrong after users set the bar width for a category bar chart.
[DQID-3054] [Chart API] A slice does not return to its original position after selection.
[DQID-3063] [Chart API]
CategoryBarChartdisplays incorrectly when the number is greater than 10.[DQID-3076] [Chart API] When the bar width is changed, bars are separated away from each other and their labels are not placed underneath.
[DQID-3069] [Chart API] The instruction in the tooltip does not correspond to the actual behavior of the chart.
Release Notes 2.6.0
Release Date: June 20, 2019
Updates and enhancements
This release contains the following updates and enhancements:
The T-I07 indicator's computation frequency can now be set to On demand, which means the indicator can be executed at any time.
The T-I11 indicator's output parameter display has been updated.
The following new indicators have been added: Least frequent field values, Most frequent field values, Field value range, Median field value, and Average field value.
When viewing a dashboard, administrators can now remove indicators from sections and sections from dashboards. These tasks no longer require navigation to the Administration area.
An administrator can now attach indicators to a dashboard directly from the dashboard screen when creating a new tile. This alleviates the requirement of having to attach the indicator to the D.E.C. in the Administration tab.
The process of importing TIBCO EBX® Data Exchange Add-on preferences has been updated.
Previous results can now be hidden when using the Digital display mode.
Release Notes 2.5.0
Release Date: March 25, 2019
Updates and enhancements
This release contains the following updates and enhancements:
The dashboard context feature has been removed. This simplifies configuration and indicator access when launching dashboards from the TIBCO EBX® toolbar. Now, the default dashboard automatically displays along with all attached indicators. The Dashboard drop-down menu can now be used to access available dashboards.
For line and bar chart improvements, see the section below.
The W-I04 indicator has been updated to ensure that its output display is more usable.
Custom charts have been updated to have the same look and feel as those generated using the add-on.
If the grouping or filter predicate features are active, the T-I03 indicator can now use the linked records feature.
The following data profiling indicators have been added:
F-I34: Number of not null values for a field
F-I35: Number of distinct values for a field
F-I36: Number of unique values for a field
F-I37: Number of not unique values for a field
F-I38: Field maximum length
F-I39: Field minimum length
F-I40: Field average length
F-I44: Highest field value
F-I45: Lowest field value
Line and bar chart improvements
This release contains the following updates for line and bar charts:
The number of annotations that display on line and bar chart tiles is now limited to the most relevant results. For example, the display no longer shows results from the current date when an indicator has not been executed recently. This can make it easier to read certain charts by reducing the number of results shown. Now, if an indicator hasn't been executed in 6 months, its tile only displays the most recent and prior executions.
The X-axis annotation formatting for bar charts has been improved and aligns with the existing behavior of line charts. For example, when the display periodicity is set to Daily, the annotations include the date of execution.
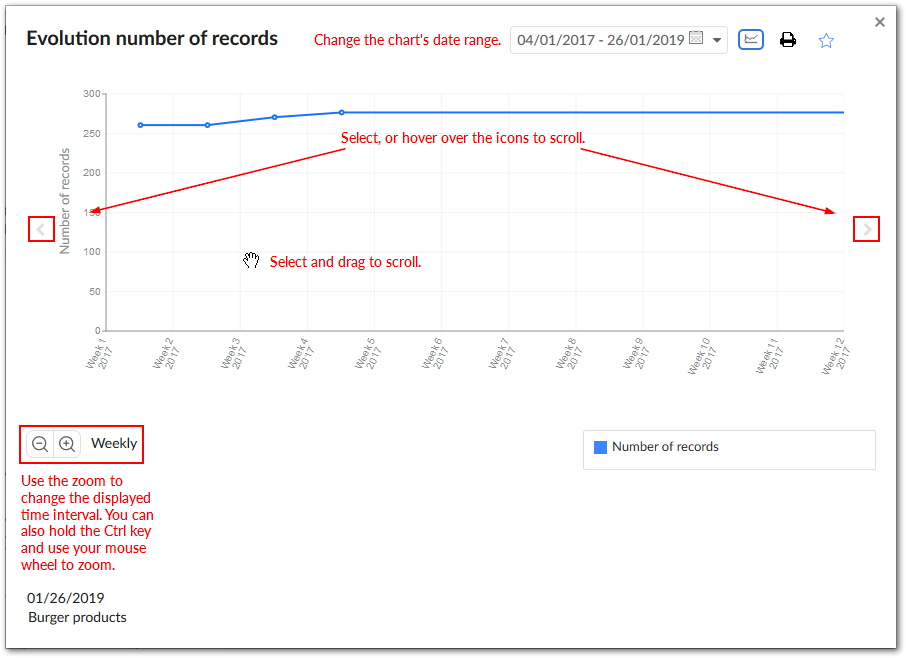
An improved scroll feature for line and bar charts has been implemented. When viewing a full size chart that includes more values than the chart can display, you can hover your mouse over the displayed arrows to the right and left of the chart, or select and drag the chart. The displayed time interval can also be changed by zooming in and out. Zooming in shows smaller, more focused intervals and vice versa when zooming out. The maximum zoom level for bar charts is daily and line charts can zoom in to the day and hour.
Known limitations
This release contains the following known limitations:
The date format used in the calendar and on chart axis annotations behaves as follows:
English: MM/dd/yyyy
French: dd/MM/yyyy
All other locales will follow English.
The number formatting on charts generated from the API does not follow the EBX® locale.
Bug fixes
This release includes the following bug fixes:
[DQID-307] [S1][IE] Indicator labels are not fully displayed in the synthesis view.
[DQID-376] Some escaped characters are not properly encoded.
[DQID-784] [Query] Execution of queries on the Filter by current user mode do not behave as expected.
[DQID-862] [Sparkline chart] The colors of the sparkline chart in an exported file are not the same as those on the dashboard.
[DQID-965] [S1][Dashboard] Incorrect behavior occurs when viewing tiles on a dashboard from a table.
[DQID-2811] Some French messages have not been translated.
Release Note 2.4.0
Release Date: October 26, 2018
Updates and enhancements
This release contains the following updates and enhancements:
The EBX Insight Add-on has undergone significant updates to ensure compatibility with the EBX® 5.9.0 GA release.
Indicators on workflow publications make use of the new EBX® API to ensure consistent results. For more information, see the EBX® Release Note documentation on workflows.
You can now temporarily deactivate indicator execution.
The Dashboard service has been updated so that its look and feel is consistent with that of configured perspectives.
Now, when you launch the Dashboard from a table, it prioritizes display of indicators related to the current table and associated components.
The Scroll mode button has been removed as part of an ongoing process to improve interaction with line and bar charts. It will be made available again in a future release.
Bug fixes
This release includes the following bug fixes:
[32848] Retrieve the publication name of a workflow to ensure the consistency of the workflow indicators results.
[33323] The Delete service is hidden after duplicating a record on the Indicator definition table.
[33991] Issues running the Purge indicators service.
[34906] The Filter by correlation field is missing on dashboards in perspectives.
[35150] Bar charts are not displayed on small dashboard tiles.
Release Note 2.3.2
Release Date: October 12, 2018
Bug fixes
[36045] A 404 error occurs when opening a dashboard and the add-on is deployed on a WebLogic server.
Release Note 2.3.1
Release Date: July 31, 2018
New features
This release contains the following updates:
Multiple dashboard sections can now have the same label.
The behavior of the F-I20 indicator has been updated to correctly reflect grouping feature functionality.
Bug fixes
This release includes the following bug fixes:
[33157] The dashboard cannot be closed when accessed from a workflow task.
[33608] The SVG generated by the chart API not is correctly dimensioned.
[34287] Dashboard icons cannot be displayed if EBX® is configured in a sub folder of the domain.
Release Note 2.3.0
Release Date: July 4, 2018
New features
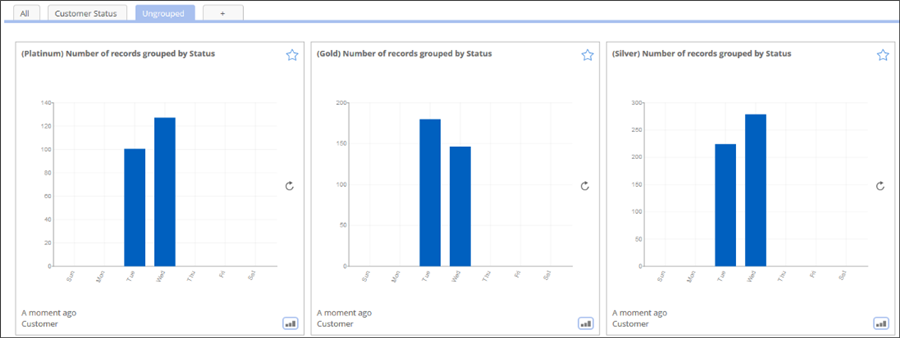
You can now group indicator execution results by value. For example, you could group results using the Status field in a Customer table. Indicators would display how many customers hold Silver, Gold, or Platinum status. You can apply the group feature to the following indicators: T-I03, F-I20, F-I31, T-I04, F-I13 and F-I18. For more details, see Overview of grouping values.
The following image shows the grouping feature when viewed in a dashboard and a tabular view of query results:

Additionally, groups can be separated so that they each display in a different dashboard tile (shown below). This can be useful to see the development of a single value over time.
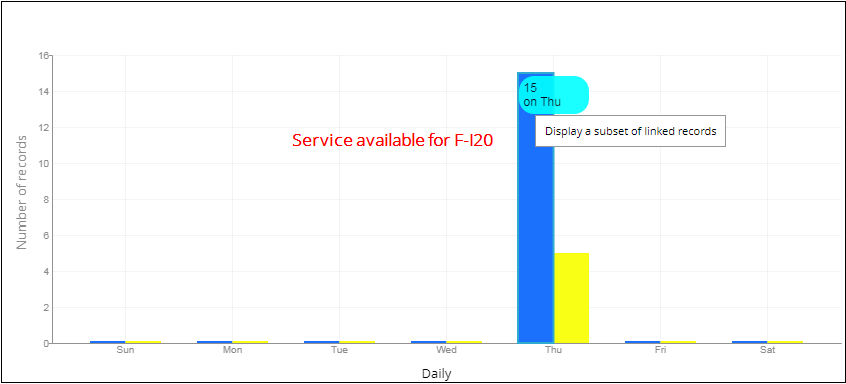
When you group results, you have the option of setting a limit on the number of groups and the order in which they display. Any groups of values not displayed due to setting a limit are included in an "Other" group. When using the F-I20 indicator, the Display a subset of linked records is now available to display a tabular view of records in the "Other" group.
New features in the API
The following new features are available in the API:
A new sparkline chart is available.
Sparkline chart output can be filtered by clicking on its corresponding legend.
Hovering over a line, bar, pie, or sparkline chart highlights its corresponding legend.
Hovering over a legend highlights its corresponding line, bar, pie, or sparkline chart.
Bug fixes
This release includes the following bug fixes:
[32713] No error message is displayed after deleting sections in the dashboard.
[33442] On line chart API, the lines and points are not highlighted when hovering over a point.
Release Note 2.2.2
Release Date: May 02, 2018
New features
The following new features and enhancements are included in this release:
Updates were made to take into account the latest version of the TIBCO EBX® Digital Asset Manager Add-on.
New features in the API
Line and bar chart output can be filtered by clicking items in the chart's legend.
Chart legend appearance has been improved.
The orientation of X axis labels has been improved.
Value display has been updated and can be customized.
Release Note 2.2.1
Release Date: March 16, 2018
New features
The following new features and enhancements are included in this release:
Updates were made to take into account the latest version of the Common Add-on.
The list of available indicators in the Attach indicators to D.E.C. service is now filtered according to the D.E.C.
Tile label display has been updated to improve readability.
To improve dashboard tile display, line charts no longer include the circles that represent data points. The data points still display in full screen mode.
Display of text for time duration in dashboard tiles has been improved.
You can now customize Boolean value output colors using the Chart preference table.
Design elements in exported PDFs of the dashboard are now consistent with dashboard design.
Bug fixes
[31459] A white page displays when users create tiles for a dashboard after deleting its section.
[31537] Percentage values are incorrectly displayed on chart.
Release Note 2.2.0
Release Date: January 31, 2018
New features
This release of the EBX Insight Add-on focuses on improvements to performance and usability for the dashboard and indicators. The following sections highlight these updates:
Dashboard layout
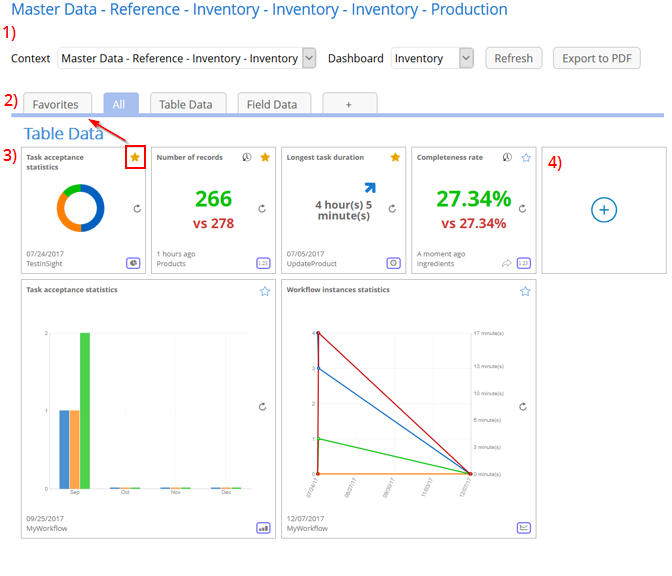
The following list describes the highlighted areas of the image below:
The title displays the current context, dashboard configuration, and storage location. In addition to using the dropdown lists to change these options, you can refresh, and export a PDF of the current dashboard.
Tabs provide navigation to dashboard sections, which are all visible from the All tab. Two tabs of note are the Favorites tab and the tab with the + icon. The Favorites tab displays all starred tiles for the current dashboard. The + tab displays for users with administrative privileges and allows you to quickly add a new section to the dashboard.
The image shows examples of large and small indicator tiles. Generally speaking, large tiles work better for line and bar charts with multiple outputs, whereas small tiles work well to display numeric output and pie and sparkline charts.
This tile displays if you have administrative privileges; click here to add an additional tile to the dashboard section.
Indicator tiles
Tiles offer digital and chart type display modes. The image below is an example of digital display mode. Callouts identify main features which are described in the list below:
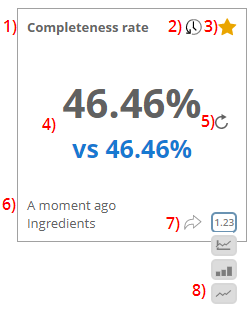
The tile's title corresponds to the indicator's name, or business label if one exists.
If enabled, you can open a tabular view displaying previous indicator execution.
Toggling the favorites icon determines whether this tile displays in the dashboard's Favorites section.
Indicator output displays in the center of the tile. The default output format (digital, or chart type) can be set be administrators.
The refresh icon enables on-demand execution of the indicator.
The information displayed here shows this indicator's time of last execution (above) and the related D.E.C.'s label (below).
If enabled, you can view the indicator's linked records.
You can click this icon to toggle the display mode—if additional modes are available.
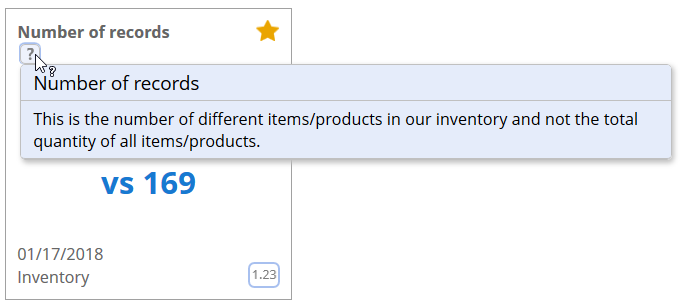
You can now customize descriptive information about indicators in the Indicator on D.E.C. table by adding a business label and description. When users mouse over the label, they can click the Show detail icon to view the description.
Digital display tiles
Tiles that display measurement over time have an icon that shows the trend between the current and previous execution (shown left). Additionally, for time based indicators, you can configure interval format display. If needed, the add-on can automatically adjust the output format so that only relevant information is shown. Indicator tiles that display feedback from numerical measurement display the current value vs the previous computation (shown right).
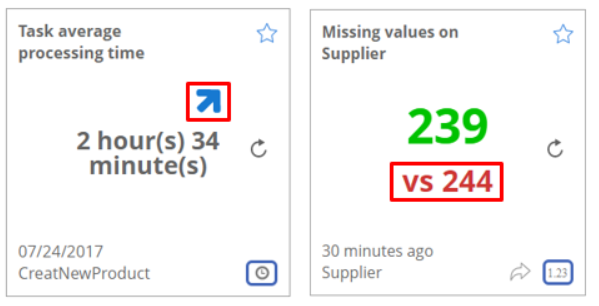
Chart tile improvements
You can double-click a chart to expand it. The following sections highlight the new sparkline chart type and the updated functionality for expanded charts.
Line and bar charts
The following highlights new features when interacting with line charts; bar charts (not shown) share these features:
You can select an entry in the legend to toggle display of the corresponding line/bar. If you hover your mouse over an entry in the legend, the add-on highlights the associated line/bar. You can also hover over points/bars on the chart to display details.
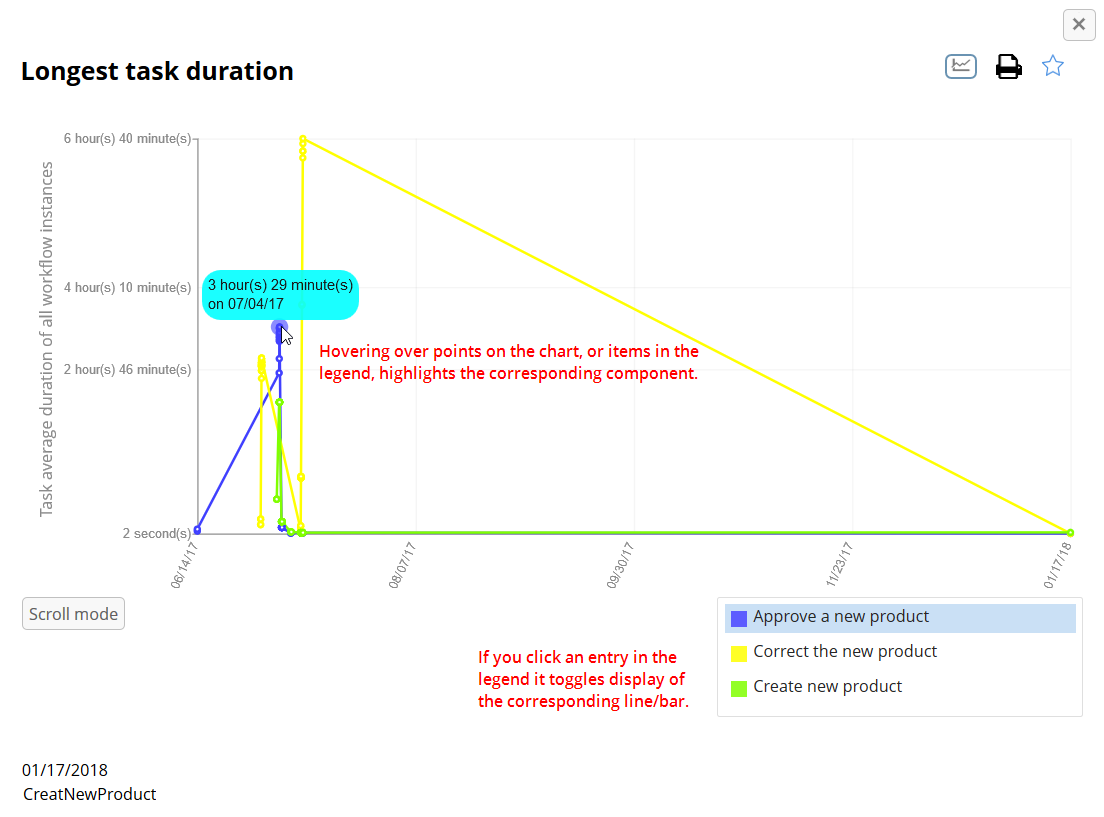
The display location for labels (along the Y axis) has been optimized. As highlighted in the above image, one of the new features conveniently allows you to filter display of lines/bars. Since the output displayed on the graph may no longer match the labels, the add-on automatically updates the displayed label to the optimal location.
If enabled, users can click the axis label to edit it while viewing the indicator:
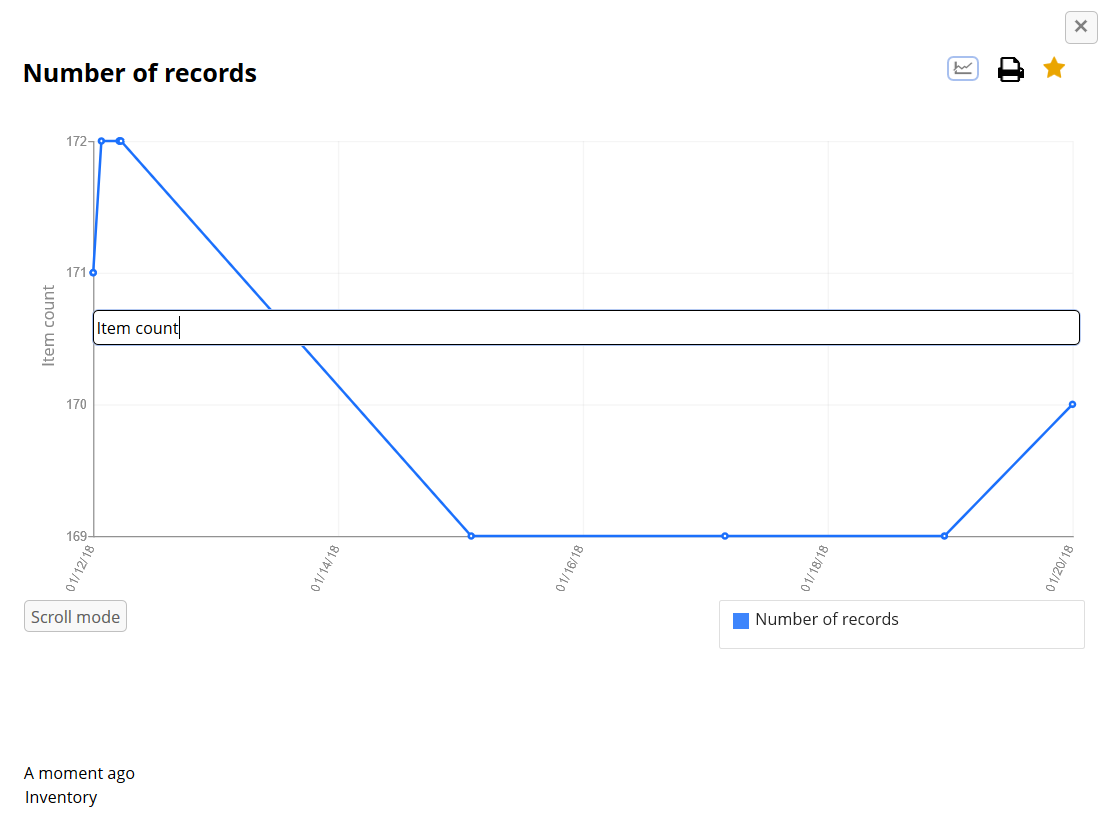
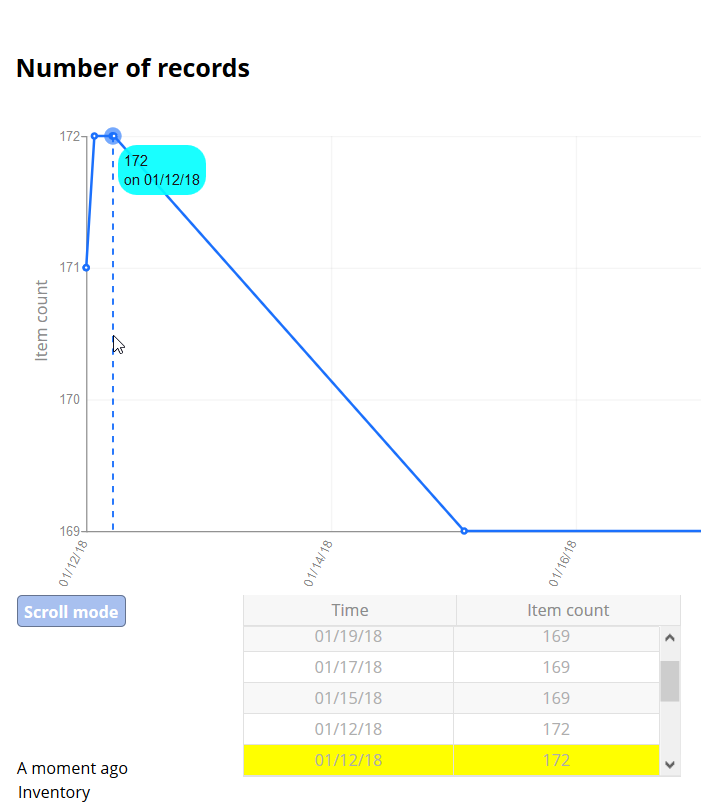
Clicking Scroll mode when viewing a line chart displays a table containing the chart's values and as you move your cursor along the X axis, the corresponding value is highlighted in the table.
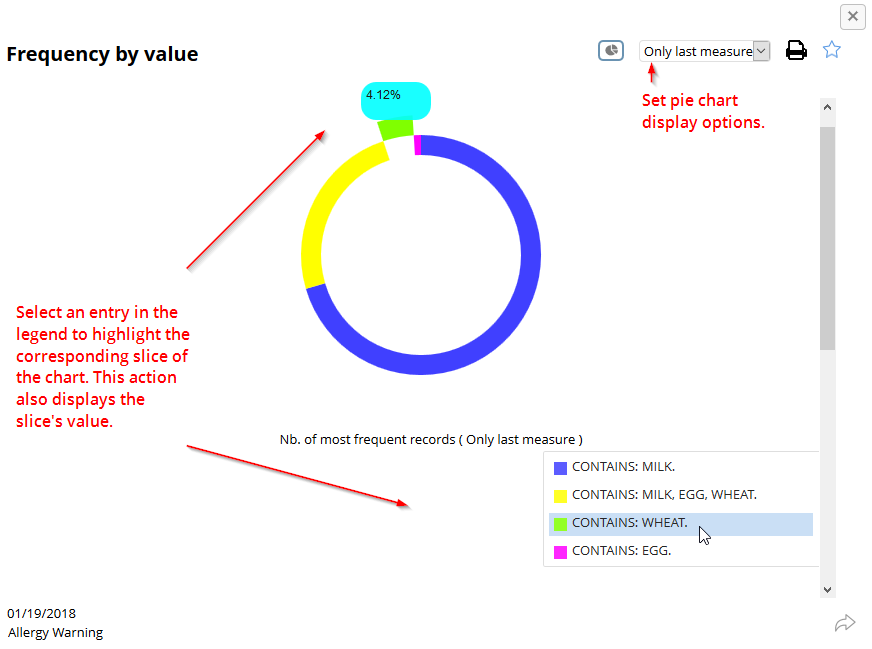
Pie charts
As shown below, pie charts enable functionality similar to line and bar charts, with subtle differences.
Displaying linked records from charts
If an admin has enabled the Linked record service for your profile, you can use the Display a subset of linked records to open a tabular view of records linked to chart values. Depending on the chart type, you can access this service when:
Pie charts: selecting a section to highlight it. Then, right-click the section and select the service.
Bar charts: right-clicking on a bar and selecting the service.
Line charts: right-clicking a value point and selecting the service.
Sparkline charts: hovering your cursor on the chart until the value displays. Then, right-click and select the service.
New chart type
Sparkline charts are now available for selection to display indicators with numeric outputs and display a visual representation of data trends. As with other charts, you can double-click tiles from the dashboard to open an expanded view. When expanded, the chart legend displays and, similar to line and bar charts, you can filter displayed values, highlight data points, and view linked records.
Additional improvements
In addition to the above mentioned improvements:
The add-on provides an auto-incremented value for Code field when you create a new dashboard, or section.
To lift restrictions on which indicators can be added to sections, the Section type field has been removed.
Bug fixes
[26074] The interval axis of a chart does not follow interval format set in the Indicator on D.E.C. table.
Release Note 2.1.2
Release Date: December 22, 2017
New features
Updates were made to take into account the latest version of the TIBCO EBX® Match and Cleanse Add-on (1.12.2.).
Release Note 2.1.1
Release Date: December 15, 2017
Data exchange 2.4.0 integration
Updates were made to leverage capabilities included in the latest version of the TIBCO EBX® Data Exchange Add-on (2.4.0.).
Release Note 2.1.0
Release Date: August 3, 2017
New features for Dynamic report
Indicators can now be applied to rolling periods. The configuration information for rolling periods can be entered in a new UI. This option is only available for indicators that support periodical computation.
An aggregate report can now be generated for an indicator's D.E.C.s. A single chart can be displayed from multiple D.E.C.s using a new display mode. This can be a chart using any of the types supported for the indicator. Depending on configuration settings, the chart can show either total or average values.
New indicators
The following new workflow indicators are now available and their calculation is based on business groups and monthly periods:
The number of workflow instances in different states and the average validation duration during a period of time can be calculated by [ON] W-109.
The number of accepted and rejected workflow items—including the corresponding completion percentage for each task—can be calculated by [ON] W-110.
Dashboard and chart improvements
A dashboard context can be defined at a more abstract data element concept level. 'Cross contexts' is a new special context used to signify that a dashboard will display the tile of any context configured to use it.
It is now possible to define URLs that link to different dashboards of the same context in Workflow and Perspective.
Pie charts can now be rendered for indicators which return multiple outcomes.
Indicator improvements
Filter predicate declaration has been improved for indicators and all table, group and field indicators will support filter predicates. Also, filter predicates will be available for real-time indicators.
Bug fixes
[24232] An exception occurs if you execute an indicator configured with an absolute path in filter predicate.
[24633] [Export PDF file] [F-I19] There is an incorrect display of the default pie chart option if you select 'Average'.
[25109] The error message is incorrect when entering an invalid value for the 'From date' field in Query.
[25263] [Bar chart] [F-I23] The bar chart is not a multiple sequence chart.
[25657] [F-I23] The label of 'Maximum number of outputs for highest/lowest frequency values' input parameter is incorrect.
[25660] [F-I24] You cannot enter a negative value into the 'Values similar to empty' field of F-I24 indicator.
[26260] [Documentation][F-I05] The description of the 'Least frequent value' output in the indicator definition is incorrect.
[26279] [Filter predicate] An exception is raised in the log when you run an Indicator with a related XPath in filter predicate.
[26343] [Pie chart][W-I05, T-I15, F-I05, F-I08] Alignment issue occurs when you view pie chart.
[26398] [Line chart] [F-I04] There is a shortage of 'Number of deletions' output on the filter option of line chart.
[26475] There is an inconsistent date format between the tabular and analytics views.
Release Note 2.0.0
Release Date: December 16, 2016
Indicator improvements
The 'Big data report' table has been replaced with a new flat table. It contains dynamic field labels and descriptions, which can adapt to any indicator without having to add extra fields for new outputs.
From now on, all built-in indicators will only support this new reporting table.
To transfer existing reporting data to the flat data table, you should run the 'Migrate to the "Flat data report" table' service on the 'Indicator definition' table in the TIBCO EBX® Insight Add-on. This should be done after upgrading to this version. The 'Big data report' table will not be supported in the future.
Please see the 'New features in the API' section for more information regarding how to declare the new reporting table in an indicator implementation.
It is now possible to define a table predicate for an indicator in the 'Indicator on D.E.C.' table to filter records before calculating the results.
Please refer to the 'Indicators portfolio' documentation for more information.
Data Element Concept improvements
Hierarchy views by data models are now supported for the 'D.E.C. (Data Element Concept)' table and the 'Indicator on D.E.C.' table.
Those hierarchy views must be updated manually by executing the 'Update the hierarchy view by data models' service on the 'D.E.C. (Data Element Concept)' table to align with the structures of configured data models.
Chart improvements
Bar charts for indicators are now supported to display the average results grouped by period.
All line charts now support line filter.
Dashboard improvements
It is now possible to configure the available display modes for a dashboard tile.
Results within a time slice and the tabular result view for a dashboard tile are now configurable for certain user profiles.
By double-clicking a chart inside a dashboard tile, you can now view a medium size chart.
The 'Open charts' action now supports the 'Only last measure' pie chart mode.
The indicator label for a dashboard tile can now be overwritten in the 'Indicators in section' table.
New features in the API
A new method to get the definition of the Flat data table in the same manner as BigDataDefinition has been added to the IndicatorDefinition interface.
The FlatDataDefinition and BigDataDefinition of an indicator must be declared to migrate the existing reporting records from the 'Big data report' table to the 'Flat data report' table.
If both FlatDataDefinition and BigDataDefinition are declared, the results of the indicator will be saved in the 'Flat data report' table.
In order to support the reporting tables in general, new classes and methods in the API have been provided to replace those that only supported the 'Big data report' table.
You can find additional information regarding these changes in the EBX Insight Add-on API's sample code.
A new method has been added to the IndicatorDefinitionContext interface to get the table filter predicate configured for an indicator.
Bug fixes
[21866] [Dashboard] No pie chart is displayed when all numeric results of an indicator are zeros.
[21941] There are duplicated preferences when exporting reporting data to Excel.
[21973] [D.E.C. purge] It is impossible to purge when the query permission is not set for all datasets in the Indicator permission.
[23063] [Indicator views] A redundant view displays after running the service if an indicator already has a manually created custom view.
[23071] You can still execute services when you do not have sufficient permission on the reporting data set.
[23475] [Line chart] The date of the X axis is not visible for charts with a single point.
Release Note 1.6.1
Release Date: October 12, 2016
Indicator improvement
All workflow indicators now support both the default mode and the legacy mode of the user task creation.
Bug fixes
[22397] [API] [Indicator] Incorrect execution results of indicators extending DefaultDECIndicator or DefaultWorkflowIndicator.
Release Note 1.6.0
Release Date: September 9, 2016
New features
Dashboards can be exported to PDFs.
New features in the API
It is possible to use an API to export dashboards without using the 'Dashboard' service.
Release Note 1.5.2 fix 001
Release Date: June 16, 2016
Bug fixes
[20812] An unexpected error occurs when the indicator returns a null value.
[20819] [Chart API] Tool-tips remain visible after moving the mouse out of the chart.
[20861] [Chart API] Charts are not displayed when the data contains special characters.
Release Note 1.5.2
Release Date: April 13, 2016
New features for D.E.C. configuration
You can utilize the new table filter to query D.E.C. records which are invalid or belong to a specified data element.
You can now remove D.E.C. records along with their relevant indicator on D.E.C using the 'D.E.C. purge' service.
Indicator improvements
You can now filter an Indicator result's relevant records using one of its linked record options if they are available.
All workflow indicators have been updated to support only the new user task creation default mode in EBX® 5.7.0.
The time interval data type is now supported for charts.
New indicators
Simple statistics on field value [ON] F-I22.
Simple statistics on string (text) field value [ON] F-I23.
Simple statistics on numeric field value [ON] F-I24.
Field compliance against a pattern [ON] F-I25.
Time series compliance [ON] F-I27.
Statistics on field interval value [ON] F-I28.
Statistics on field relation [ON] F-I29.
Field value completeness [ON] F-I31.
Please refer to the 'Indicators portfolio' documentation for more information.
Updated indicators
A new input option has been added to the following indicators to allow calculating a task's processing time from when it was offered or allocated:
Task average processing time for a workflow publication [ON] W-I04.
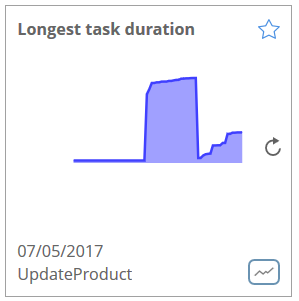
Longest task duration [ON] W-I05: Including the ability to calculate the average task duration for all instances.
Workflow publication average processing time [ON] W-I06.
Task average processing time for a workflow publication [ON] W-I04: The chart for this indicator displays duration values grouped by task.
Longest task duration [ON] W-I05: The chart for this indicator displays duration values grouped by task.
Matching statistics [ON] T-I08: The chart for this indicator displays numbers of records grouped by matching state.
Please refer to the 'Indicators portfolio' documentation for more information.
Execution and query UI improvements
Improvements have been made to the 'Execute and query' service and the synthesis view to match EBX®'s look and feel.
A compact view of the indicator result UI is now available and provides more space to explore reporting data.
Various tool-tips have been added to all tabs in the execution and query UI to provide more service configuration information.
Bug fixes
[18415] [All browsers] Alignment problem on Query and Purge screens when resizing pane.
[18600] [Indicator query] Charts are not available for the 'Nearest' query option with full date-time specified.
[18923] You can now configure datasets for indicator execution in the 'Indicator on D.E.C.' table to avoid duplication of execution on all datasets that share the same data model.
[18967] [W-I05] Duration of a task returns when it is deallocated.
New features in the API
A new method has been added to get the configured dataset for execution from the definition context.
New methods have been added to get and set the reference reporting path for a linked record option in the linked record definition.
In addition to providing the default implementations for optional indicator properties, it is possible to define business behavior in the new DefaultDECIndicator and DefaultWorkflowIndicator classes.
API improvements
It is now possible to register multiple Indicator definition instances of the same Java introspection class. This facilitates grouping similar Indicator definitions without having to declare a lot of classes.
Release Note 1.5.1 fix 003
Release Date: February 26, 2016
Updated indicators
On-demand execution is now available for the following indicators by activating the target table and field's history:
Table last modification date [ON] T-I01
Field last modification date [ON] F-I01
Please refer to the 'Indicators portfolio' documentation for more information.
Release Note 1.5.1 fix 002
Release Date: February 4, 2016
Bug fixes
[19145] The dashboard UI cannot load when the language is set to French.
[19256] Charts are displayed incorrectly when applying the 'Most recent' and 'Oldest' mode filters.
[19258] [Dashboard] Should display Indicator label or Indicator code when the dashboard label for an Indicator is missing.
Release Note 1.5.1 fix 001
Release Date: January 18, 2016
Bug fixes
[19022] The label is missing on the 'Correlated watchdog indicator results for dashboard' service.
Release Note 1.5.1
Release Date: November 19, 2015
Bug fixes
[18060] Raised watchdog indicators can now be displayed in the dashboard UI.
Release Note 1.5.0
Release Date: September 16, 2015
Watchdog indicator
You can now declare a watchdog indicator through a logical expression that handles any number of the indicator's outputs. In the previous version, the boolean output is available only to declare a watchdog. For instance, you can combine the outputs 'date' and 'number of operation' into a logical expression to raise an alert.
Correlated watchdog indicators
You can combine two or more watchdog indicators into a correlated watchdog to raise an alert spanning indicators results. For instance, you can oversee the correlation of the indicators 'Number of records' and 'Missing value'.
The correlation results are saved with the indicator outputs, and display in the UI query and the dashboard.
New indicators
See the 'Indicators portfolio' document for more information.
Task average processing time for a workflow publication [ON] W-I04.
Longest task duration [ON] W-I05.
Workflow publication average processing time [ON] W-I06.
Release Note 1.4.3
Release Date: July 31, 2015
Bug fixes
An error message is generated when registering an erroneous Indicator definition before the add-on is started.
Release Note 1.4.2
Release Date: June 29, 2015
Bug fixes
You can now define two graphs in the same page with the Chart API.
The system can work normally after deleting a data set configured for a dashboard context.
Release Note 1.4.1
Release Date: June 10, 2015
Updated indicators
See the 'Indicators portfolio' document for more information.
Number of operations on the tables in a dataset [ON] D-I03: This indicator now computes both total numbers of operations and average numbers of operations on all tables in a dataset. A new input parameter has been added to display either the total results or the average results for charts.
Release Note 1.4.0
Release Date: June 4, 2015
Execution and query
You can now filter indicator results by D.E.C. types. For instance, these filters allow you to see the results for a 'Table' D.E.C. only, or 'Field', 'dataspace', etc.
New indicator synthesis view
A new UI is available to display indicator results as a condensed computation. For instance, if the 'Number of records' indicator is queried on three tables, the synthesis view displays the average of the three results. The synthesis displays - in a condensed view - the digital results (number) the boolean, the percentage (graphical bars) and the dates.
Dashboard
The dashboard tile now holds an info-tip displaying the indicator's full label and its business description.
Dashboards integrated inside the 'TIBCO EBX® Information Governance Add-on' (IGov) add-on: In some models, EBX Insight Add-on might be configured to show indicators for tables and fields. In IGov, these indicators will be shown if the administered items for target tables and fields are configured in EBX Insight Add-on. A new tab named 'Quality' in IGov's UI shows indicator dashboards configured for administered items.
Configuration
You can now overwrite the following properties when configuring the 'Indicator on D.E.C.' table: 'Input parameters', 'Saving options' and 'Linked record' options.
The 'Indicator view' table now filters by the selection of dataset storage.
You can now configure many email recipients and use the CC, BCC declaration.
Services
A new 'Attach indicators to D.E.C.s' service (D.E.C. table) allows you to easily create the 'Indicators on D.E.C.' configuration.
The 'D.E.C. creation' service (D.E.C. table) allows you to easily create the different type of D.E.C.s (Table, Field, dataspace, etc.). This service replaces the 'D.E.C. table creation' and 'D.E.C. field creation' services.
Linked records
You can now configure an indicator to save 'linked records' in the results table. For instance, the 'Number of missing values for a field' indicator saves the list of records for which the field is missing. This list of 'Linked records' is displayed through the UI query and dashboards (new service in the title dashboard).
The list of indicators supporting 'Linked records' is as follows (see the 'Indicators portfolio' document for more information):
Table updated [ON] T-I02.
Table completeness rate [ON] T-I04.
Matching statistics [ON] T-I08.
Number of missing values in a table [ON] T-I16.
Number of validation items (error, warning) [ON] T-I17.
Empty field [ON] F-I03.
Frequency by value [ON] F-I05.
Field min-max modifications for a period [ON] F-I08.
Field with the highest frequency for a period [ON] F-I09.
Field with the lowest frequency for a period [ON] F-I10.
Boolean field occurrences within the table scope [ON] F-I12.
Number of missing values for a field [ON] F-I18.
Number of records by group [ON] F-I20.
Translation rate applied to a field [ON] F-I21.
New indicators
See the 'Indicators portfolio' document for more information.
Matching statistics [ON] T-I08.
Number of validation items (error, warning) [ON] T-I17.
Translation rate applied to a field [ON] F-I21.
Number of dataspaces and snapshots without description [ON] D-I08.
Number of child dataspaces and snapshots created for a given period [ON] D-I09.
Dataspace lifetime [ON] D-I10.
Number of operation execution [ON] O-I01.
Operation average execution time [ON] O-I02.
Updated indicators
See the 'Indicators portfolio' document for more information.
Frequency by value [ON] F-I05.
Field with the highest frequency for a period [ON] F-I09.
Field with the lowest frequency for a period [ON] F-I10.
Number of operation by the most and least active user on a table [ON] T-I15.
New features in the API
Three new D.E.C. types have been added: 'Operation' (TIBCO EBX® Activity Monitoring Add-on), 'Business rule' and 'Permission rule' (TIBCO EBX® Rules Portfolio Add-on).
Support for the complex data types for the D.E.C. 'Indicator on D.E.C.' and indicators execution.
Two new indicator value types have been added: 'Percentage value' and 'Interval value'.
Support for enumerations and HTML component types for indicator input parameters.
New methods have been added to declare the indicator business description, to define that an indicator has many result records in the 'Big data report' table, and to define the business for linked records.
For other improvements, please refer to the Java doc.
Backward compatibility
Since EBX Insight Add-on 1.4.0 introduces some new features, there is some backward compatibility:
Defining and implementing indicators: New mandatory methods in IndicatorDefinition and IndicatorDefinitionContext.
Other changes: New mandatory methods in DataElementConcept and IndicatorStorage.
Release Note 1.3.6
Release Date: April 27, 2015
Bug fixes
An unexpected error occurs when running service "Update D.E.C. labels" on the hierarchy view "By DEC" of "Indicator on D.E.C." table.
Only the result tab is available when all Indicators on D.E.C. of an Indicator are deleted and another one is created.
Release Note 1.3.5
Release Date: April 9, 2015
Permission optimizations
The computation of the permissions has been optimized.
Release Note 1.3.4
Release Date: January 26, 2015
Dashboard
When an indicator returns multiple results, you can now select the result to use for tile display. The tiles can be customized by user-profile.
New API
API to draw charts based on data values regardless of indicator management. This API allows you to fully control how charts display data in EBX® to complement the EBX Insight Add-on charts and dashboards.
New indicators
See the 'Indicators portfolio' document for more information.
Number of records by group [ON] F-I20.
Release Note 1.3.3
Release Date: November 19, 2014
Filter results by current user
Add an option in the configuration allowing to show the "Filter results by current user" option in the Query tab of the service "Execution and query".
Add the ability to filter the results by current user in the query tab of the service "Execution and query" if this option is activated in the configuration.
Add an option in the Dashboard allowing to filter by current user the results of an indicator's tile.
Release Note 1.3.2
Release Date: November 10, 2014
UI improvement
The menu action in tile dashboard is improved to be more flexible. If the indicator does not support any charts, the open chart and change display mode in menu action for a dashboard tile is not presented.
The result content in "Check configuration" service will display with full height.
Bug fixes
When an owner with an empty email is added to a D.E.C. record, indicators on this D.E.C. won't save the results in the Big data table when executed.
In some configurations, the context selection is not displayed fully list after changing to [Workflow] context.
Block on Dashboard tile when displaying Dashboard of a context contains special characters.
Pie chart doesn't work when the data includes the comma character.
Section label displays wrongly after changing Section type from D.E.C. type to Business type.
Release Note 1.3.1 fix 001
Release Date: September 30, 2014
Bug fixes
Cannot delete the preference if a user isn't in Administrator role.
Release Note 1.3.1
Release Date: September 12, 2014
API
New API to get information from the configuration.
Release Note 1.3.0 fix 001
Release Date: August 7, 2014
Indicator results view
For the indicators having results of type Boolean, the result view is enriched with the two properties "Watchdog on" and "Sent email".
Bug fixes
When a dashboard configuration had no 'Default data storage', it made unavailable the other dashboards.
In some configurations, the 'workflow' context in the dashboard menu entailed unexpected errors.
The dashboard name is added in the title of the dashboard view.
Release Note 1.3.0
Release Date: July 17, 2014
Watchdog
You can now declare watchdogs and apply them to any Boolean type output parameters. For instance, the 'Empty field' indicator returns a boolean value of 'True' when the field is undefined. On this output, a watchdog can be configured to automatically raise an alert.
Direct modification of the pre-built indicator definitions
You can now configure pre-built indicator definitions properties.
UI improvement
You can now collapse and expand the 'Classification' and 'Preference' query criteria.
The query's dates selection has undergone usability improvements.
Email management
The automatic email notification is now performed when a watchdog raises an alert.
Pre-defined variables are now available to dynamically enrich templates emails and include for example: ${table} (current table's label in execution time), ${field} (current field's label in execution time), ${workflow} (current workflow's label in execution time).
New UI services
The 'Refresh label from data model' service is used to re-align Data Element Concept (D.E.C.) labels when the logical names in the data model have changed (also applied to workflow and dataspace names).
The 'Create Indicator view declaration' service is used to automatically create a declaration of the views in the 'Indicator view' table.
Dashboard
A dashboard can now be configured with sections of 'Business' types that contain several indicators of any D.E.C. type.
A tile can now be configured with a default display mode: digital, chart and pie-chart.
You can now select which dashboard to display from a list of available dashboards.
A dashboard can now be configured for a context based on a dataspace, dataset and table. Depending the dataspace, dataset and table on which the user is working, the appropriate dashboard attached to this context displays.
A new button allows a user to execute a dashboard refresh.
In EBX® 5.5, the dashboards are displayed through an icon located on the EBX® toolbar.
A tile is now enriched with actions that are available to users that open the graph and change the display mode (digital, chart, pie-chart).
Analytics view
The chart options (colors, line width, etc.) can now be configured by user-profiles and/or indicators.
It is now possible to dynamically choose a filter to apply on results. This filter must be declared in the Indicator implementation (refer to the API).
New indicators
See the 'Indicators portfolio' document for more information.
Number of active users on a table by operation [ON] T-I11.
Number of missing values in a table [ON] T-I16.
Field min-max modifications for a period [ON] F-I08.
Oversee string field value [ON] F-I14.
Oversee boolean field value [ON] F-I15.
Oversee date field value [ON] F-I16.
Oversee numeric field value [ON] F-I17.
Number of missing values for a field [ON] F-I18.
Missing time series for a field [ON] F-I19.
Dataset completeness rate [ON] D-I01.
Dataset freshness [ON] D-I02.
Number of operations on the tables in a dataset [ON] D-I03.
Dataspace information [ON] D-I04.
Java API changes
The API has been improved to manage input parameters with new data types such as numeric, boolean, date. Now, you can manage multi-occurred input parameters.
A new API is available to access to the tables used for result storage: Big Data Report, Indicator Report and Indicator Value.
For other improvements, refer to the Java doc.
Release Note 1.2.0
Release Date: March 31, 2014
Preference management and indicator classifications
The query and execution of the indicators rely on the management of preferences. A preference is a group of indicators ready to execute or query.
The query and execution list of indicators can be filtered by indicator classification.
New services
The new service 'Indicator on Data Element Concept (D.E.C.) creation' allows attaching one indicator to all D.E.C.s in a data storage automatically.
The new service 'Purge indicators' allows physically deleting the indicator results depending on criteria based on the dates and the D.E.C. types.
Dashboard
It is now possible to configure dashboards to display the indicator results. A dashboard is made up of one or more tiles showing the indicator results in an easy to read layout (specific data, color coding, etc.).
New indicators
See the 'Indicators portfolio' document for more information.
Number of operations by the most and least active user on a table [ON] T-I15.
Number of active users on a field by operation [ON] F-I04.
Field value outside a limit [ON] F-I06.
Field size outside a limit [ON] F-I07.
Field with the highest frequency for a period [ON] F-I09.
Field with the lowest frequency for a period [ON] F-I10.
Boolean field statistics [ON] F-I11.
Boolean field occurrences within the table scope [ON] F-I12.
Group of fields' completeness [ON] F-I13.
Indicator name changes
'Table not updated [ON] T-I02' has been renamed 'Table updated'.
'Field not updated [ON] F-I02' has been renamed 'Field updated'.
Migration of indicator definitions
A service 'Migrate indicators definition' must be executed to make existing indicator definitions compatible with version 1.2.0. This service is located on the table 'Indicator definition' in the configuration. It is only executed once to perform the migration.
Java API changes
Pie chart support.
Support for indicators with the D.E.C. type of 'Is group' and for managing watchdogs of the decimal data type (previously only the Integer data type was supported for watchdog configuration).
Improvement of the API to filter compatible D.E.C.s by indicator.
Other improvements: See the JavaDoc.
Release Note 1.1.2
Release Date: January 14, 2014
New indicators
See the 'Indicators portfolio' document for more information.
Table freshness [ON] T-I06.
Number of operations on a table [ON] T-I07.
Frequency by value [ON] F-I05.
Completed workflow instances since last execution [ON] W-I08.
Release Note 1.1.1 fix 001
Release Date: December 23, 2013
Bug fixes
Fix a bug when using a custom directory.
Release Note 1.1.1
Release Date: December 18, 2013
Permission management
The performance of the report display has been improved to manage a large number of D.E.C. and indicators (thousands of D.E.C.).
Label management
The D.E.C. label of type field is now prefixed with the name of the related table.
Operation
The operation 'D.E.C. creation field' can be configured to create all fields of all tables in a dataset.
Release Note 1.1.0
Release Date: December 10, 2013
Permission management
It is now possible to configure the business permissions applied to the execution and querying of indicators. These permissions complement the EBX® standard permissions.
For example, permissions can be configured such that a given user is not permitted to access to a table according to EBX® permissions, but is authorized to execute certain indicators on that table. Moreover, the permissions are configured by dataset context and D.E.C. to filter the indicators that are permitted, depending on the environments execution.
New service to create D.E.C. fields automatically
It is now possible to automatically create all D.E.C. fields for a table.
New user interface
The execution, query and results of indicators are now separated into tabs, and the results can be filtered by D.E.C.
The indicators applied to workflows are launched from the reference dataspace.
The 'dates selector' component has also been improved to be able to query by date ranges.
New types of graphs
It is now possible to configure and use graphs with multi-curves.
Also, the type 'pie chart' is now available.
New indicators
See the 'Indicators portfolio' document for more information.
Number of workflow publications [ON] W-I01.
Number of open workflow instances per publication [ON] W-I02.
Number of work items per state for a workflow publication [ON] W-I03.
Table completion rate [ON] T-I04.
Record creation matching state [ON] T-I12.
Record modification matching state [ON] T-I13.
API
The API has been improved to allow implementing new indicators.
Release Note 1.0.1
Release Date: October 8, 2013
New updates
Display has been improved in order to minimize memory usage on the client-side.
A new identifier allows retrieving all indicators executed at the same time in the 'Big Data' table.
Bug fixes
[8274] On Firefox 3.6, the paging mechanism on tabs for display results does not work.
Release Note 1.0.0
Release Date: September 30, 2013
EBX Insight Add-on provides a portfolio of ready-to-use indicators to monitor the quality of data over time. This portfolio can be further enriched with custom indicators. The indicators can be used to assess the quality of any asset known to EBX®, such as tables, fields, workflows, dataspaces, data sets, and business rules.
List of indicators provided with the add-on
See the 'Indicators portfolio' document for more information.
Indicators applied to a table
Table last modification date [ON] T-I01.
Table not updated [ON] T-I02.
Number of records [ON] T-I03.
Indicators applied to a field
Field last modification date [ON] F-I01.
Field not updated [ON] F-I02.
Empty field [ON] F-I03.
Configuration of the indicators
Watchdogs, Periodicity of control.
Automatic creation of the Data Element Concepts on which indicators are associated.
Computation frequency: on demand, real-time, time-line.
Graphs
Results are displayed through graphs in (x,y).
API
API to publish bespoke indicators into the add-on. These bespoke indicators benefit of the configuration and the execution framework provided by the add-on.