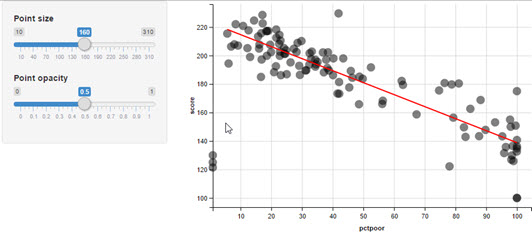
Displaying a Linear Model on a Scatterplot with ggvis
If you want to create an interactive graph that is similar to one you can create in ggplot2, you can install the ggvis package.
About this task
For information about the packages used in this example task, see http://ggvis.rstudio.com/.
Note: If you use RStudio,
the results are displayed in the RStudio Viewer pane.
Before you begin
Procedure
Results