After you have registered a data function in
Spotfire Analyst,
you can save it to the library to be used by others, or you can edit the
parameters, and then embed it in your analysis.
About this task
Perform this task
in
Spotfire Analyst,
from the
Register Data Function dialog box.
Procedure
-
Click
Run to save the data function and embed it
into the analysis.
Optionally, you can click
Save As to save the analysis to the library,
but for the example, continue testing the data function by running it.
The
Edit Parameters dialog box is displayed.
-
In the
Edit Parameters dialog box, in the
Input tab, provide the following settings.
| Option | Description |
|---|
| Refresh function
automatically |
For the example, select the check box to update the results
from the data function automatically each time the input settings are changed.
If the check box is cleared, you must perform a manual refresh for any updates
to take effect.
|
|---|
| Input parameters |
Lists the input parameters for the data function. For the
example, this table displays the example's one parameter,
x. |
|---|
| Input handler |
Lists all possible input handlers for the selected input
parameter. The settings populating the dialog box depend on the selected input
parameter. By default, the option
None is selected. For the example, select
Columns. In the resulting options, specify
the following.
- Click
Select Columns, and then add all
columns (
Group,
x1, and
x2).
- Scroll down and
under
Limit by, select
Marking.
|
|---|
-
Click the
Output tab and, for the example output parameter
(
y), set the
Output handler to
Data table.
-
Acccept the default
Create new data table, provide a suitable
table name, and then click
OK to run the data function.
-
In the
Register Data Functions dialog box, click
Close.
You are prompted to save the data function to the library.
Click
Yes to save it for reuse, or
No to just continue running the example.
-
On the
Spotfire Analyst
toolbar, click the
Table visualization icon to add a second
table.
-
In the second table, from the
Data table drop-down list box, select the
table you created with the data function.
The table visualization is blank.
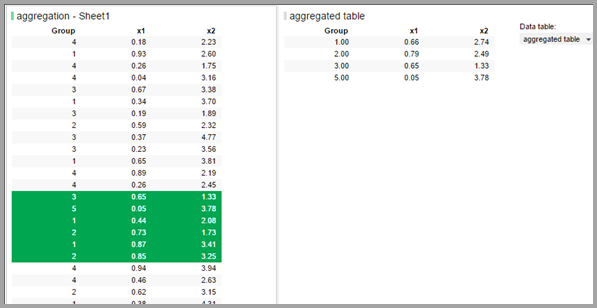
-
In the first table, select a range of rows.
The second table is populated with an aggregation from the
selection in the first table.