Prometheus
You can use a variety of other third-party tools, such as Prometheus and Grafana, to store, analyze, and visualize monitoring data.
Prometheus is an open source toolkit for systems monitoring and alerting.
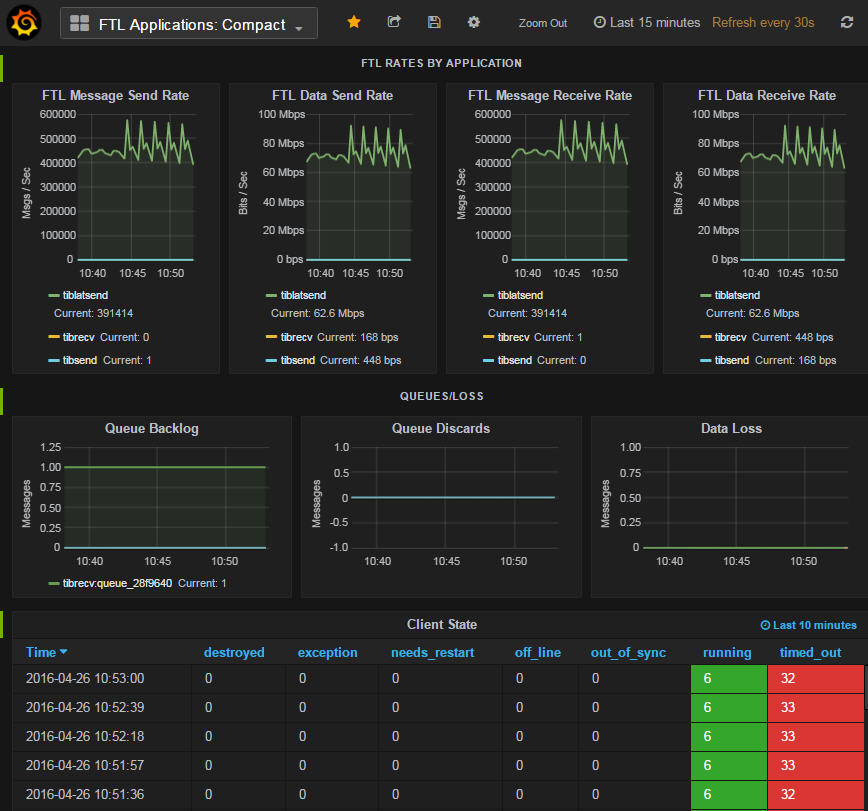
Grafana is an open source application for visualizing large-scale measurement data.
You can run Prometheus and Grafana processes in Docker containers. TIBCO FTL software includes sample Docker files to configure and build Docker images for this purpose. Grafana dashboards in the sample are tailored to display FTL monitoring data. (See Docker Files for Prometheus and Grafana.)
Pushgateway and Adapter
Prometheus scrapes data from monitoring sources into its data repository.
Prometheus cannot receive data directly from FTL applications or the realm server. Instead, Prometheus provides an intermediate component, called Pushgateway, that receives data and caches it so that Prometheus can scrape it at a regular interval.
Pushgateway is not an FTL application, so it cannot subscribe to the monitoring message stream. TIBCO FTL software includes an adapter application, called tibpromgateway, that subscribes to the monitoring stream and posts the data to Prometheus Pushgateway.
To understand the context within which these processes cooperate, see the diagram in Data Flow of Monitoring Metrics.
For technical details, see Monitoring Data: Timing and Interruptions.

