Data Flow of Monitoring Metrics
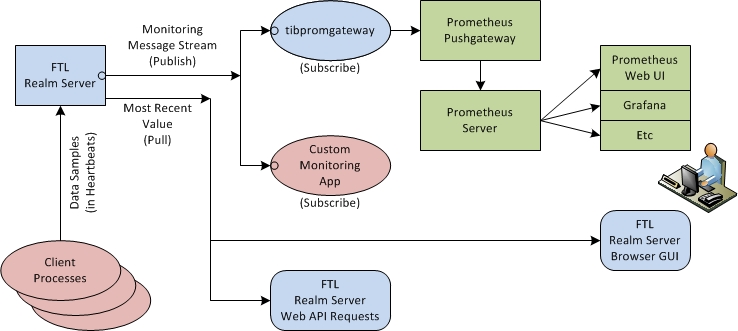
The following diagram illustrates the flow of FTL monitoring data.
Explanation of the Diagram
- Metric data begins in client processes. The TIBCO FTL client library monitors the metrics relevant to each client, and includes monitoring data values in the heartbeat data that it sends to the TIBCO FTL realm server.
The realm server receives the monitoring data from its client processes.
- When the realm server receives monitoring data from any of its clients, the realm server immediately publishes that data in an FTL message. The stream of those messages is called the
monitoring stream.
Any FTL application can subscribe to the built-in monitoring endpoint to receive the monitoring stream.
- You can develop custom monitoring applications that subscribe to the monitoring stream and use the metrics data.
- TIBCO FTL software includes an executable application,
tibpromgateway, that subscribes to the monitoring stream and makes the monitoring data available to Prometheus.
Prometheus is an open-source systems monitoring and alerting toolkit. You can access the data directly from Prometheus, or using other tools that manipulate and display the data, for example, Grafana.
For more information about this data pathway, see Prometheus, and the topics that follow it.
- The realm server retains only the most recent value of each metric from each client.
These values are available from the realm server through its web API and browser GUI.
Change in Functionality
This arrangement reduces memory usage in the realm server, and makes the data available to analytical tools in a more timely and useful manner.