Viewing the Agent Details
In Hawk Console, you can create rulebases and rules to monitor a Hawk agent. Also, you can view all the alerts related to the Hawk agent.
Procedure
| 1. | Start the Hawk Console and sign in with your user name and password. For steps, see Starting Hawk Console. The Hawk Console dashboard is displayed with the Alerts heat map and domain information cards. |
| 2. | On the Hawk Console dashboard, click the information card for the domain whose Hawk agent you want to view. |
| 3. | On the Domain’s page, click the information card for the Hawk agent for which you want to view the details. The Hawk Agents page with multiple tabs (for Hawk agent actions and information) is displayed. |
Result
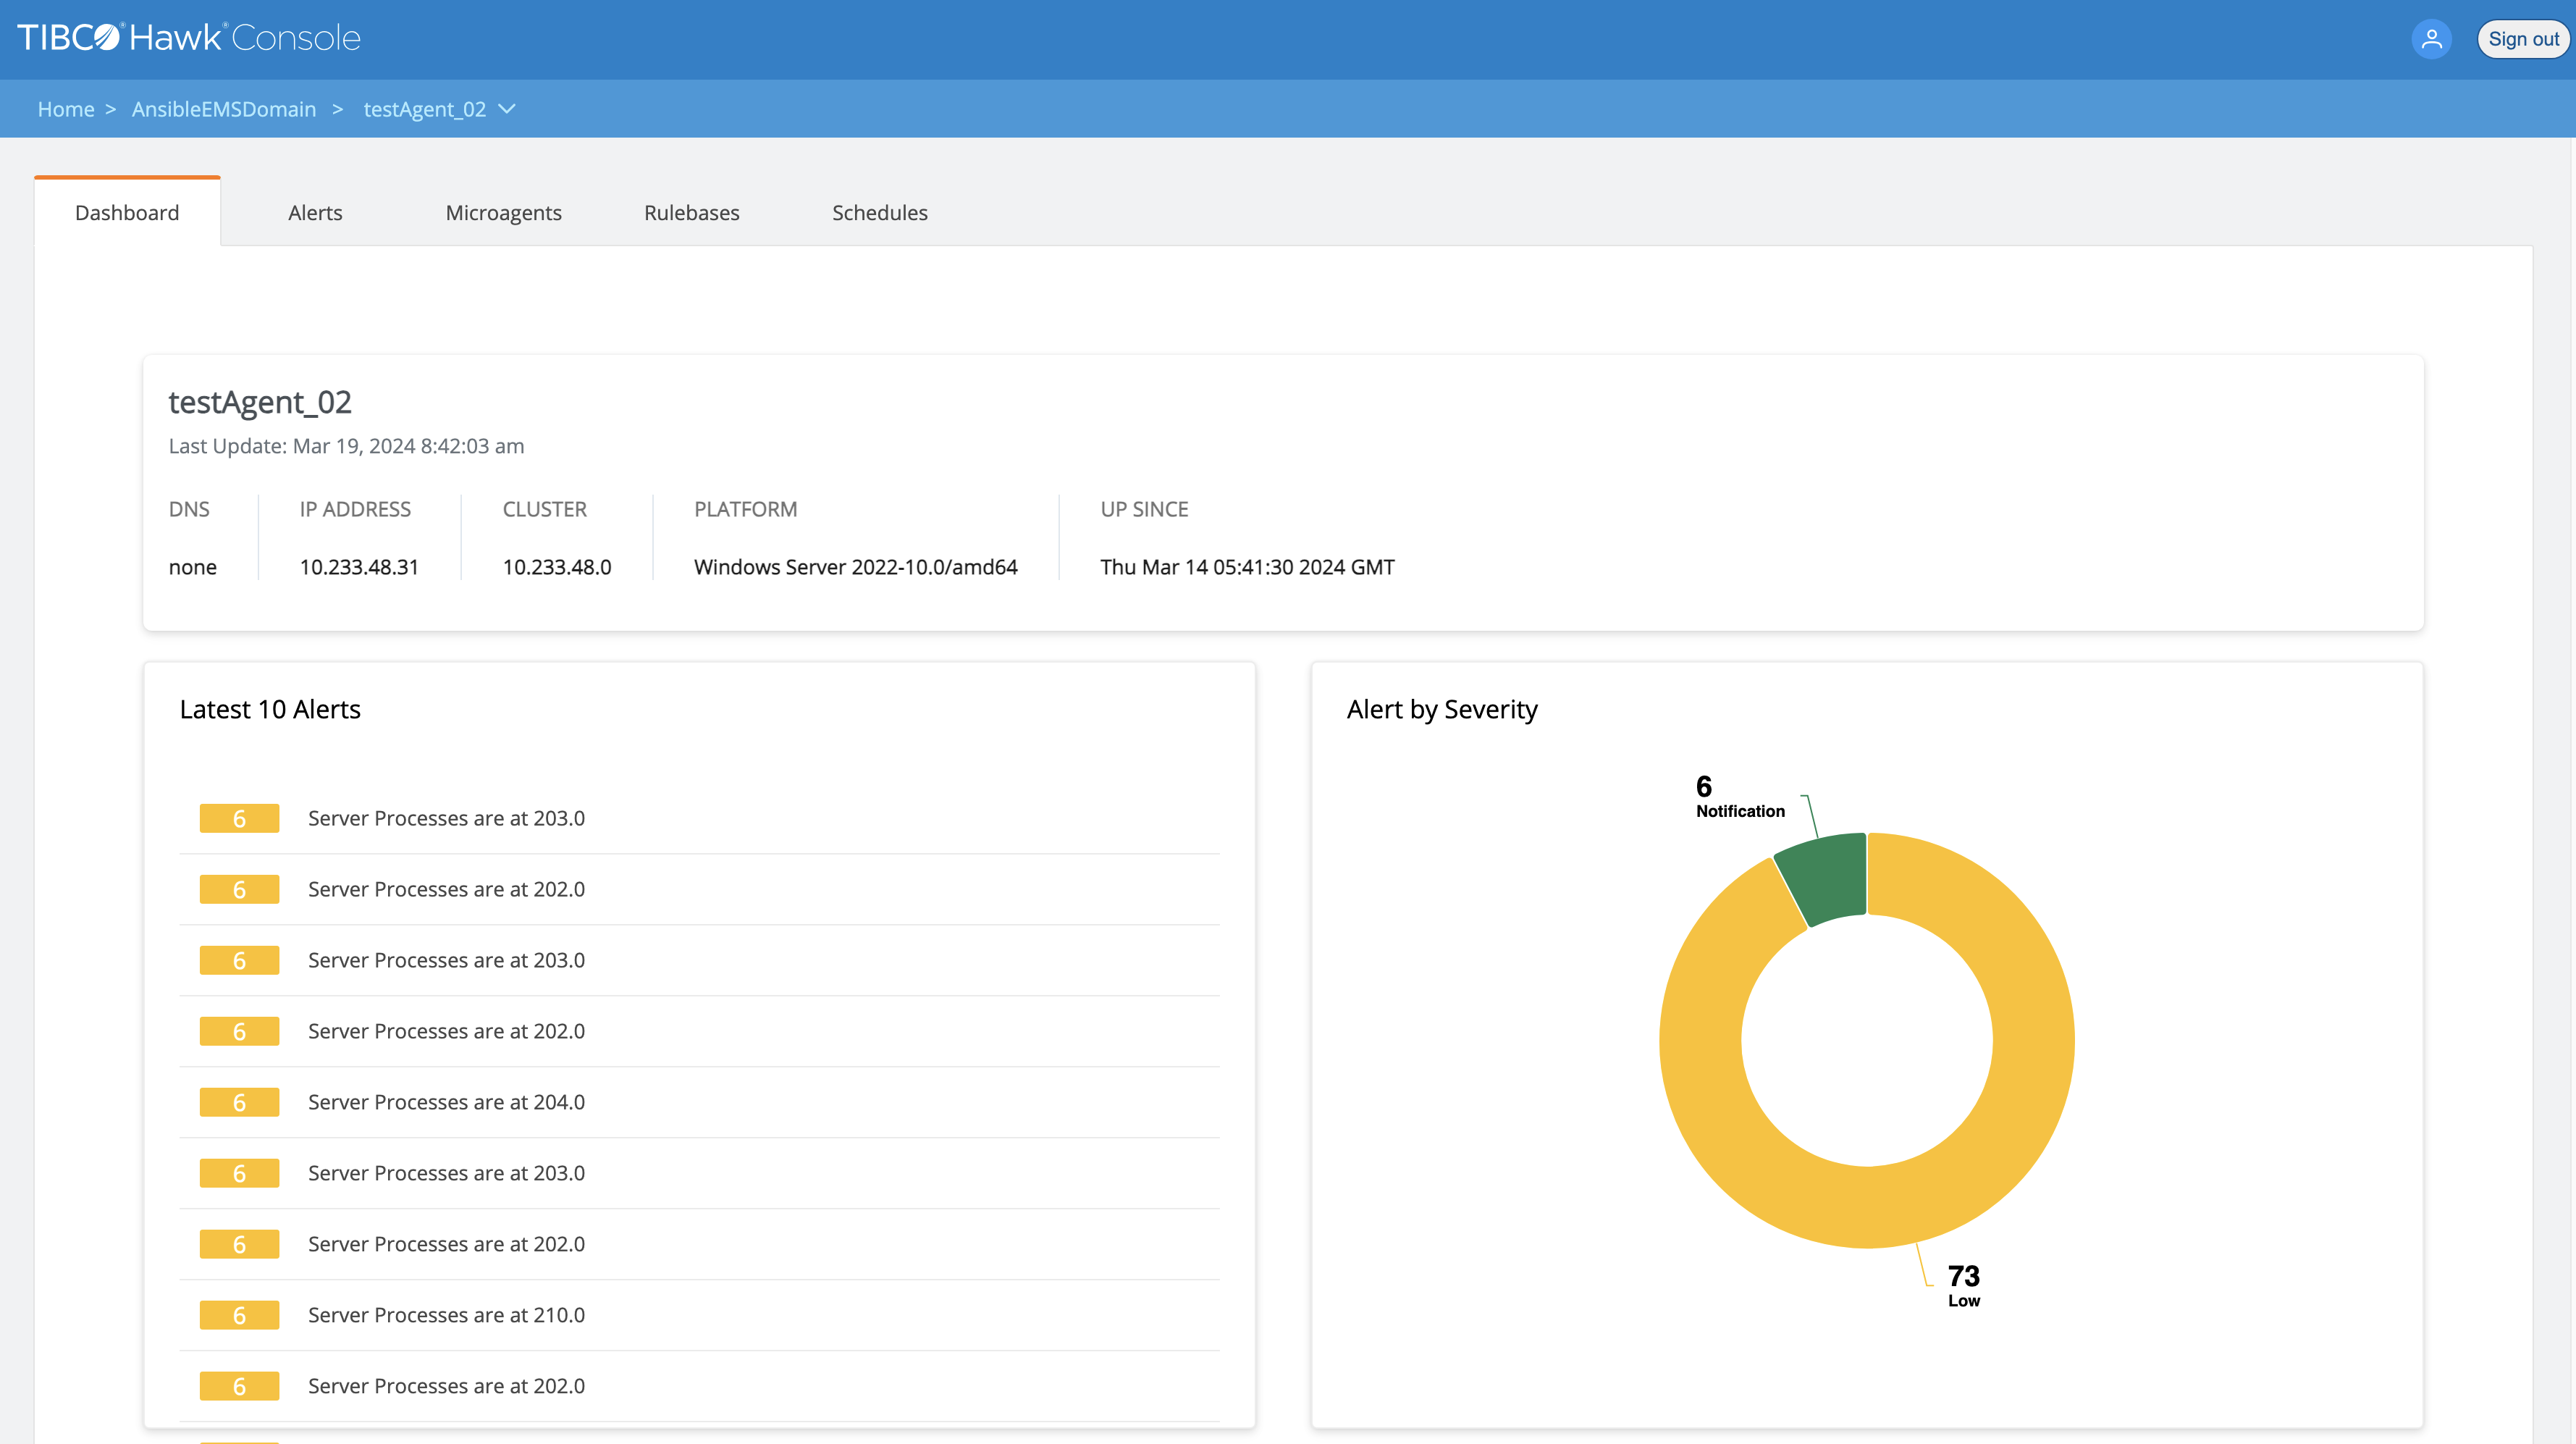
The Agents page displays the following tabs to perform various functions:
| • | Dashboard - It displays agent’s and alerts information in a single view. For details, see Dashboard Tab. |
| • | Alerts - The Alerts tab lists all the alerts for the Hawk agent in a table. For details, see Alert Messages. |
| • | Microagents - In the Microagents tab, you can view microagents and their methods for the Hawk agent. For details, see Microagent Management. |
| • | Rulebases - The Rulebases page shows all the rulebases for the agent. For details, see Rulebase Management. |
| • | Schedules - The Schedules tab enables you to define a schedule and deploy the schedule to the Hawk agent. For details, see Schedule Management. |
Figure 20: Agent’s Details Page