Support
Support allows you to perform following tasks:
- View the usage of all the active scoring pipelines.
- View information about open sessions for ModelOps UI
- Generate diagnostics for technical support
Contents
Usage
In this section, you can see the graphical representation of scoring pipeline usage. The ModelOps UI offers two charts based on count and size. You can download all the usage data by clicking the Download All Usage Data (JSON) present at the upper-right corner of the page. You also get the option to see the usage graphs in stacked format by checking off the box for Stacked present below the graphs.
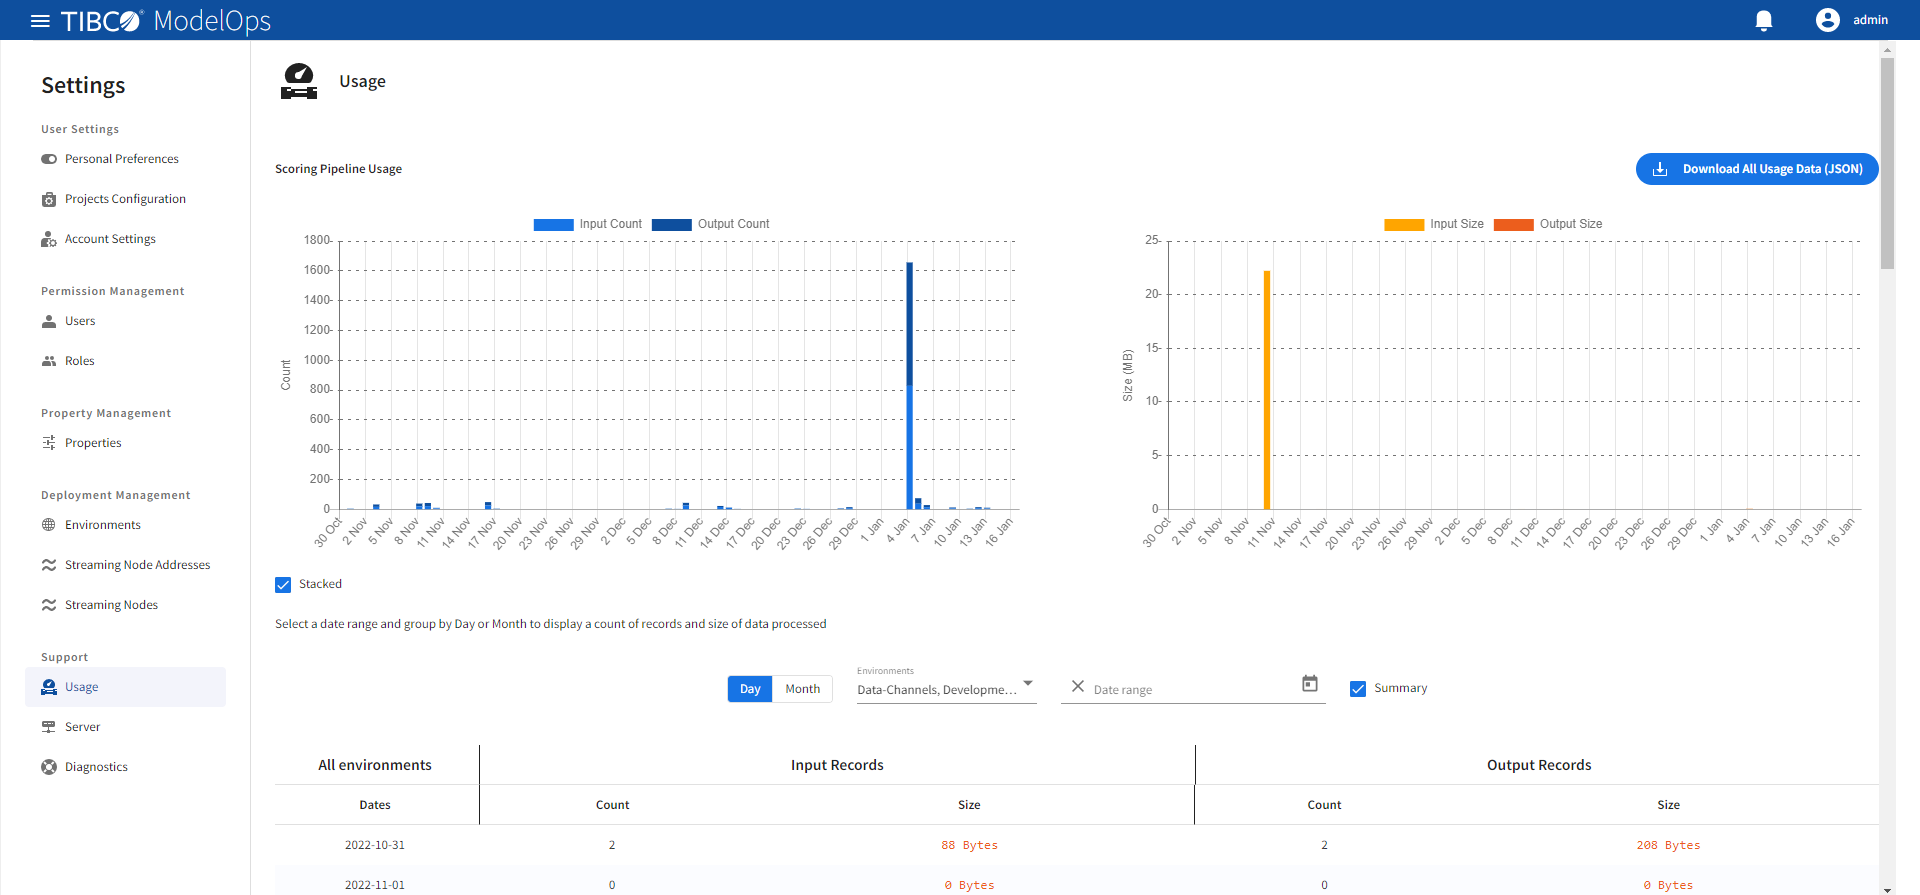
Administrators can also select a date range and group by day or month to display a count of records and size of data processed. You can also view data for specific environments. Administrators can view the input and output records based on count and size, too.
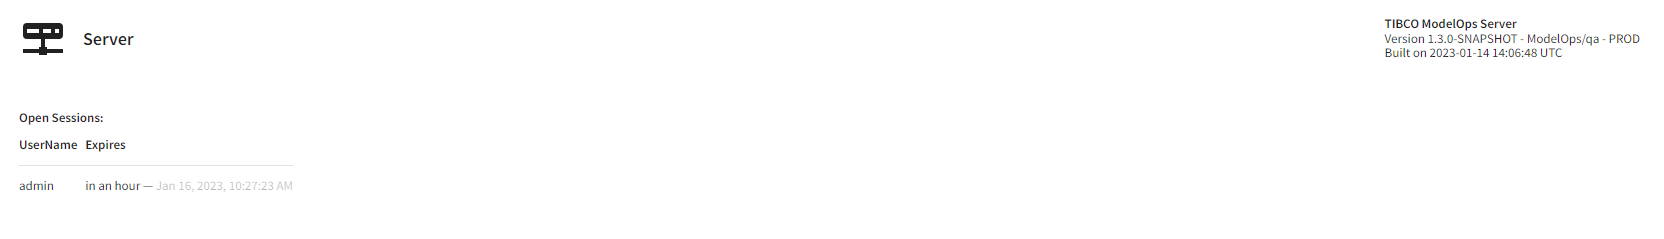
Server
This section displays information about the active sessions. The information displayed includes the version number, build details (such as the time when ModelOps UI was built), user name, and the time when the session is about to expire.
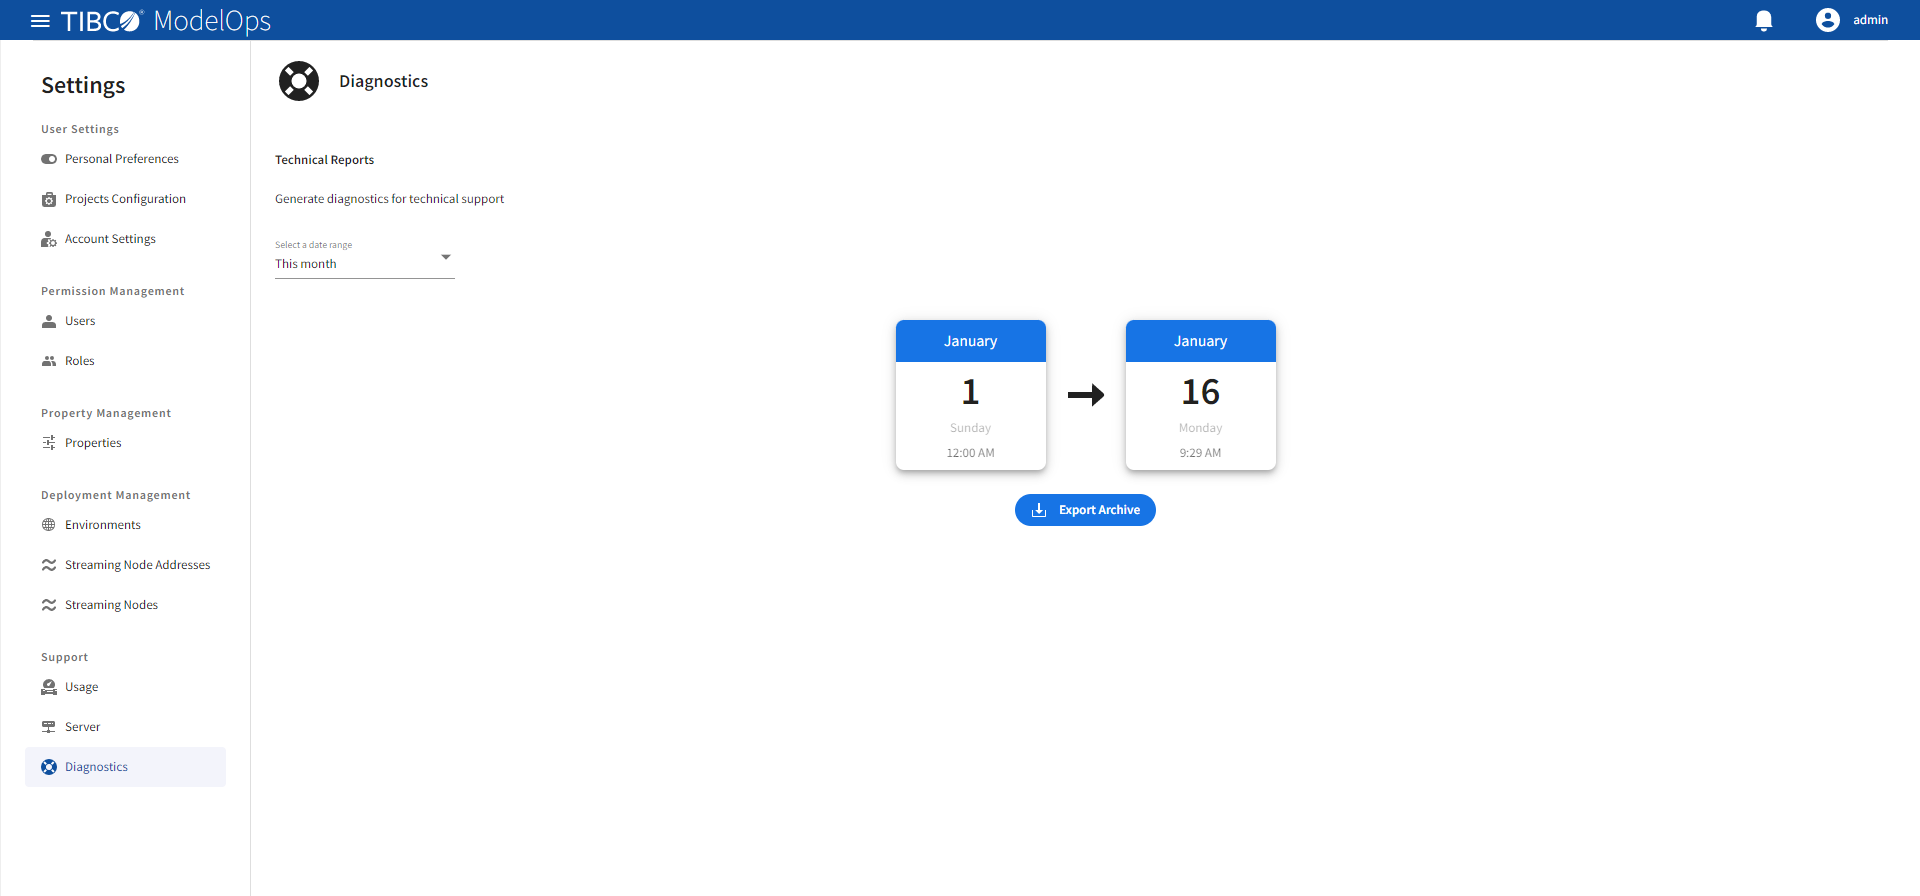
Diagnostics
This section allows you to generate diagnostics for technical support. You need to select a date range and click Export Archive. This will download the .zip file of diagnostics reports.