Traces
The Traces tab displays the traces for an application. A trace represents a complete execution made up of single or multiple spans. For more information, see Traces.
Configuration requirements to enable tracing for TIBCO ActiveMatrix BusinessWorks5
To enable tracing at application level, add the necessary properties in the application TRA file located at <TIBCO_HOME>\tra\domain\<Domain_name>\application\<application_name>\.
To apply the configuration across all the applications deployed and created from a specific TIBCO_HOME, add the properties to bwengine.tra.
| Properties | Description |
|---|---|
java.property.bw.engine.opentelemetry.enable=true
|
To enabling tracing use this property. Note: By default auto mode is selected.
|
java.property.otel.exporter.otlp.traces.protocol=http/protobuf
|
The |
java.property.bw.engine.opentelemetry.disableAutoConfiguration=true
|
Use this property to disable the default auto mode and set it to manual mode. |
java.property.bw.engine.opentelemetry.span.exporter=OTLP-HTTP
|
For manual mode the span exporter is set to |
java.property.otel.exporter.otlp.traces.endpoint=http://<BareMetal_DP_MachineName>/tibco/agent/o11y/<DataPlane_ID>/traces
|
For auto configuration mode, define this property as the endpoint. |
java.property.bw.engine.opentelemetry.span.exporter.endpoint=http://<BareMetal_DP_MachineName>/tibco/agent/o11y/<DataPlane_ID>/traces
|
For manual configuration mode, define this property as the endpoint |
View Traces
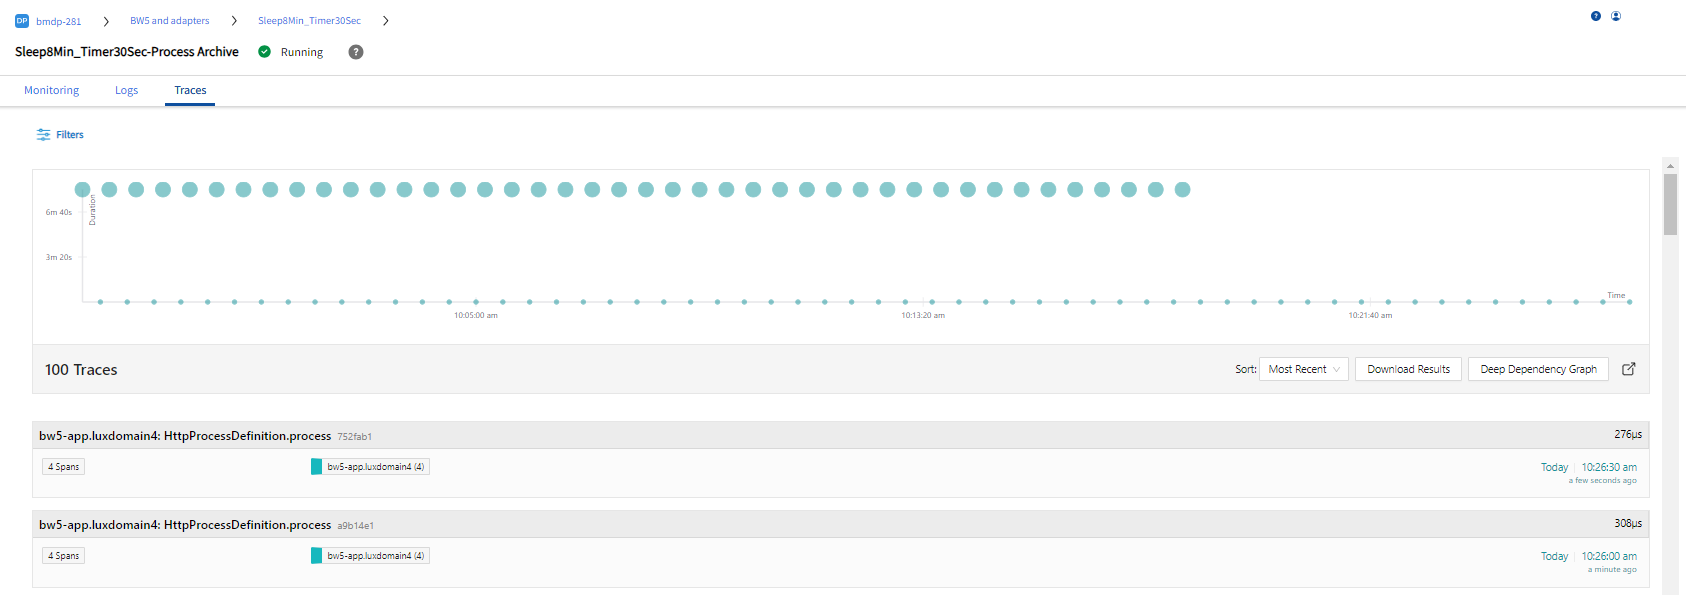
On the Traces tab, click Filters , and select the Time range and Limit. By default the graph displays 100 traces and traces data for the last hour. Click Apply Filters.
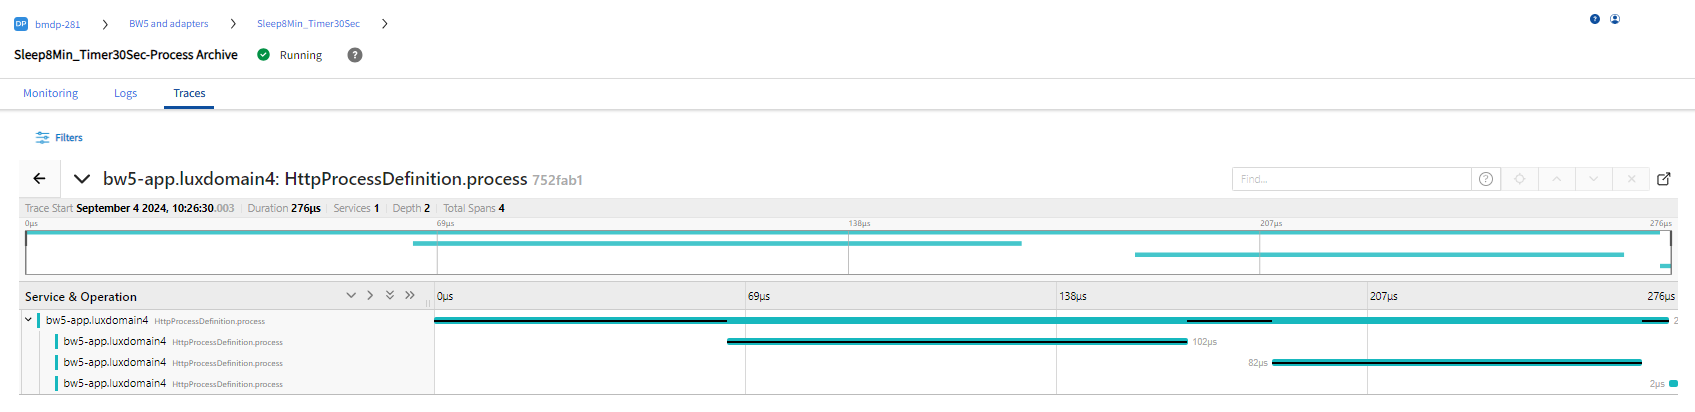
Trace Detail View