Filtering Observability Data
You can filter the data of the card on the dashboard and details page by using different filters. By default all charts display observability metrics collected during the last 24 hours except for the Application Instances card, which displays real-time data. You can filter data by time maximum up to last 48 hours.
-
You can specify one or more tags to filter data by tags. If multiple tags are applied, data from apps having at least one of the tags is displayed. You can specify a maximum five tags at a single time.
-
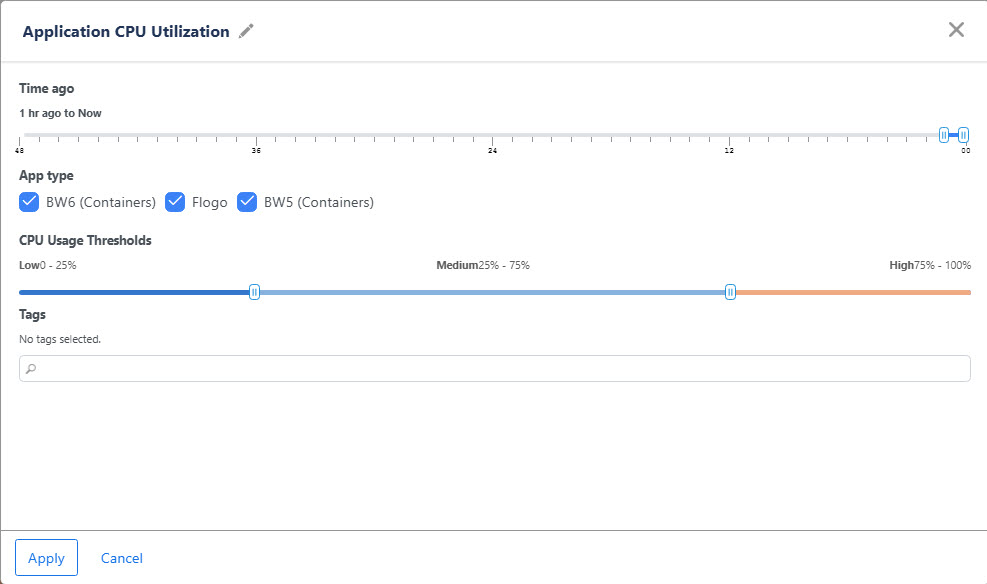
For Application CPU Utilization card, you can use the CPU usage threshold to filter by using the custom threshold percentage.
-
For the Application Memory Usage card, you can use the Memory usage threshold to filter by using the custom threshold percentage.
-
On the details pages, click
 to view more granular data. You must narrow the time range on the graph to enable this icon. To view granular data, the selected time range must be more than 5 hours.
 -
You can rename the card.
Available Filters
After you create the dashboard, you can apply the filters to filter the data. Using filters, you can modify your view and explore your data in real-time.
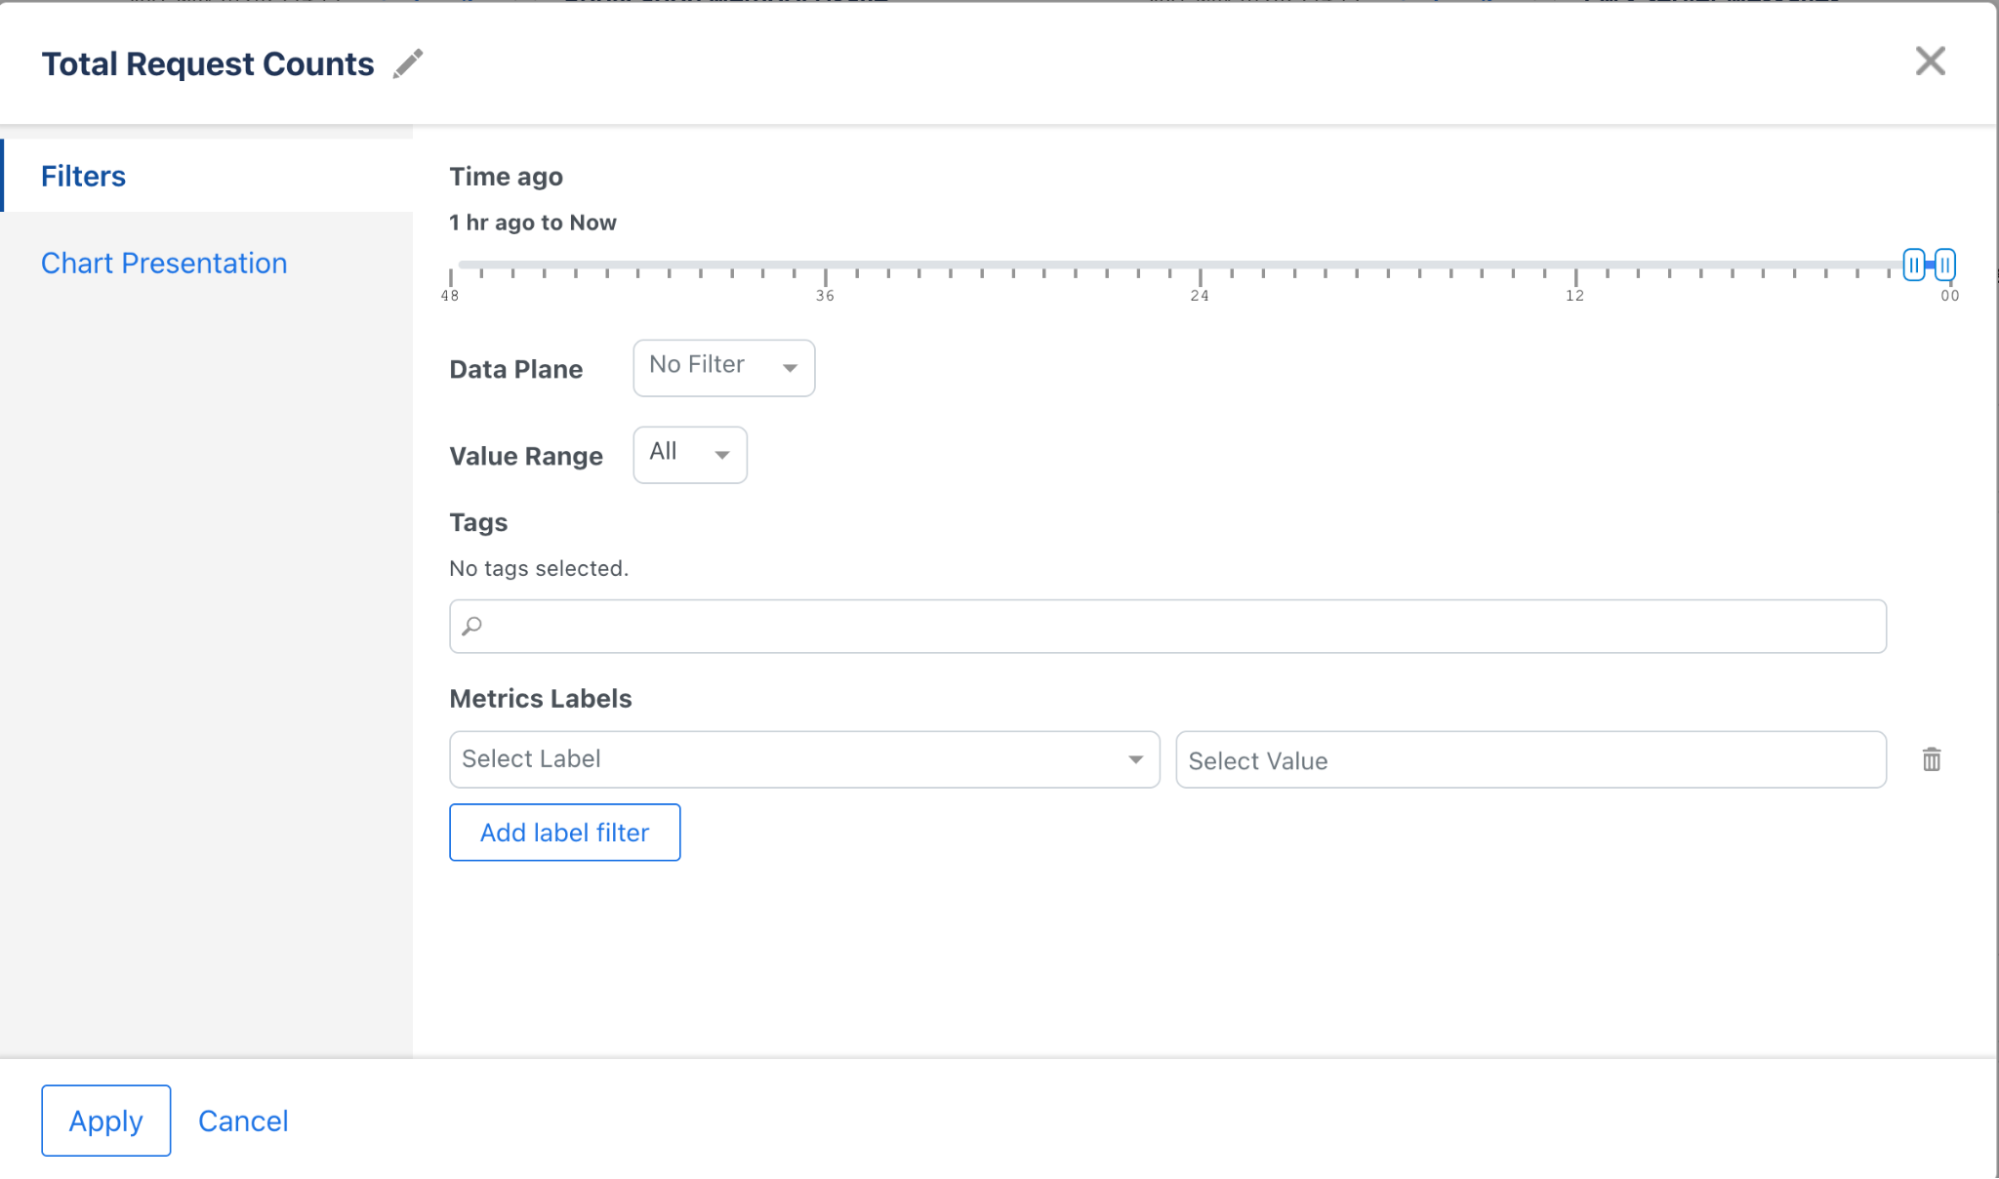
Time Ago
Filter data points based on the number of hours ago (up to 48 hours). The default is the last hour.
Data Plane
Applicable when the Global Observability Configuration resource is selected in the dropdown on Observability dashboard. This filter allows filtering by a specific data plane. Only one data plane can be selected. To configure the Global Observability resource, see Configuring Observability Resource.
Value Range
Filter results based on value range operators (Above, Below, Between). Examples: Filter data points for the ratio of the Application Memory Usage over the Allocated Resource Limit collected that is only above 80%.
Tags
Filter based on tags associated with TIBCO BusinessWorks 6 (Containers) and TIBCO Flogo apps.
Metrics Labels
Further narrow down the results using metrics labels collected in Prometheus. Every metrics label value added is added as a “AND” matching criterion. If multiple values of the same metrics label are added, it is treated as an “OR” match criterion.
Examples:
To filter on the application name = myApp1 or myApp2 deployed in the application namespace = myAppNamespaceC, add the following app labels:
-
Label application_name = myApp1
-
Label application_name = myApp2
-
Label application_namespace = myAppNamespaceC
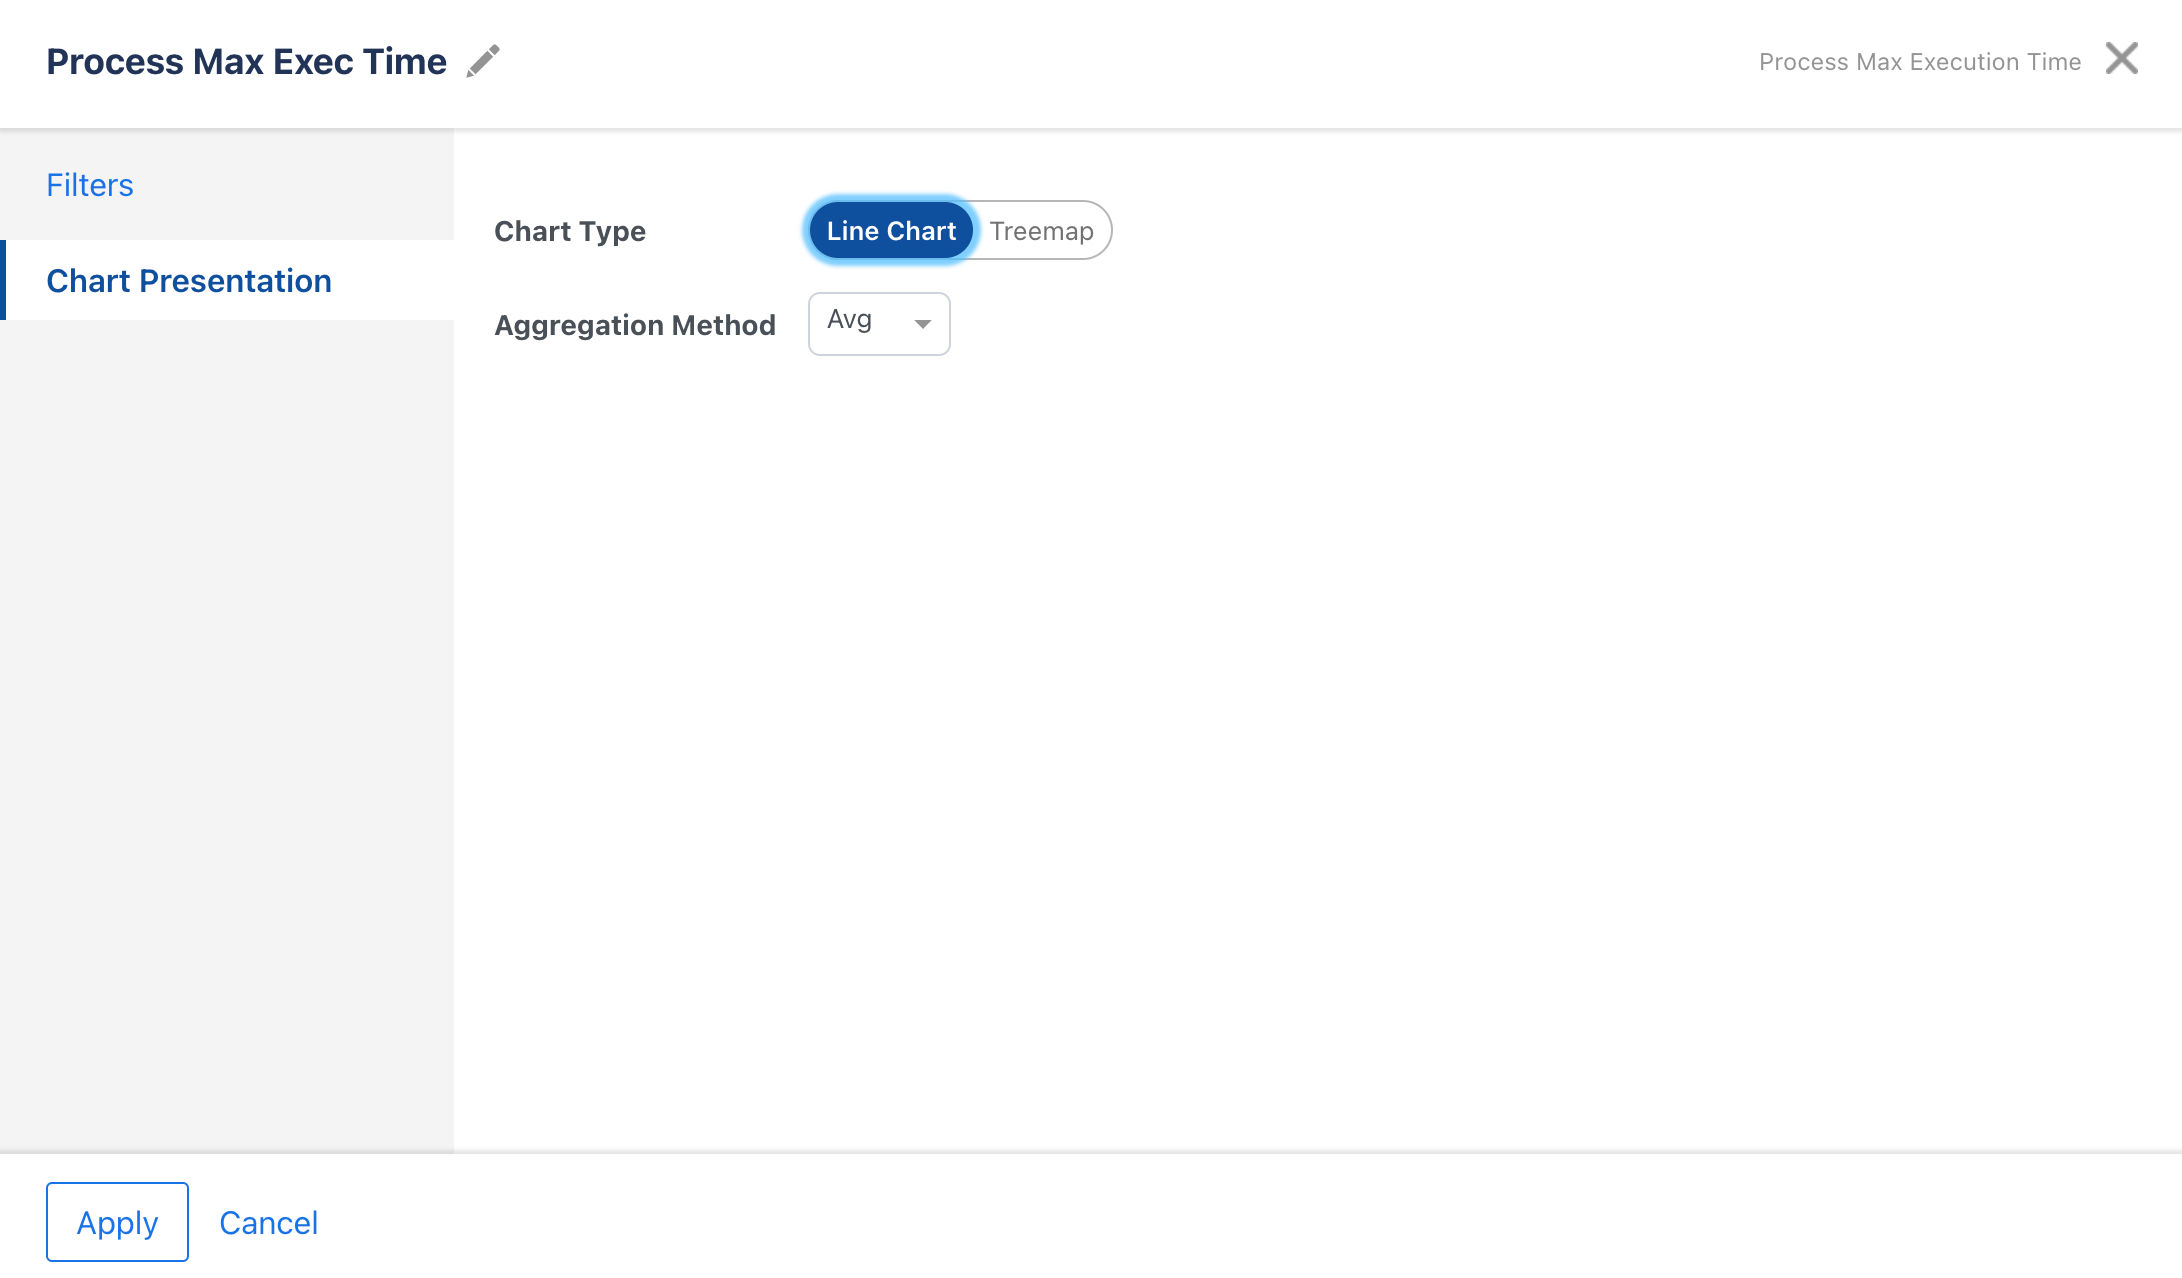
Chart Presentation
You can select the chart display type as Line chart or Treemap.