Contents
The Cluster Monitor application is a ready-to-run and configurable StreamBase Application that can be used to monitor the performance of clusters and nodes in a StreamBase Runtime fabric. The application consists of a StreamBase monitoring EventFlow fragment and a LiveView server fragment. The application:
-
Dynamically discovers cluster elements (nodes, JVMs).
-
Dynamically discovers changes to the cluster population.
-
Provides StreamBase performance data for EventFlow and LiveView JVMs.
-
Provides StreamBase Runtime performance data for nodes.
-
Publishes results into a set of LiveView tables.
-
Provides a set of LiveView Web cards that present a customizable view of the data.
Using the default configuration, the LiveView server automatically enables LiveView Web as the client to display cluster monitoring data.
Note
The Cluster Monitor must be run in a separate cluster from the one containing the applications being monitored.
-
To run the Cluster Monitor application, enter a node name to install to. For example,
monitor..monitorCluster-
On Windows, you must use a StreamBase Command Prompt.
-
On macOS and Linux, you must use a shell with a StreamBase-ready environment, as described in Configure Shells for StreamBase.
The epadmin command line below wraps to the next two lines for clarity but must be entered as one command:
epadmin install node nodename=monitor.
monitorClustersubstitutions="NODE_NAME=monitor.monitorCluster" application=$TIBCO_EP_HOME/distrib/tibco/sb/applications/cluster-monitor.zip -
-
Start the node. Run:
epadmin servicename=monitor.
monitorClusterstart node -
Verify the LiveView server is now active. Look for the following start node command output:
... [monitor.
monitorCluster] Starting node [monitor.monitorCluster] Engine application::liveview-server started [monitor.monitorCluster] Engine application::cluster-monitor started ...Alternatively, look for the following message in the
monitor.file to confirm the LiveView server is active:monitorCluster/logs/liveview-server.log*** All tables have been loaded. LiveView is ready to accept client connections.
Once the node is started and the Cluster Monitor application is running, open a browser to view cluster data for the started node (at least one node must be installed to view any meaningful data in LiveView Web).
Enter: http://localhost:11080/lvweb. The Cluster Monitor application uses 11080 as its default LiveView Web port, to avoid conflicts with the standard LiveView
Web port, 10080.
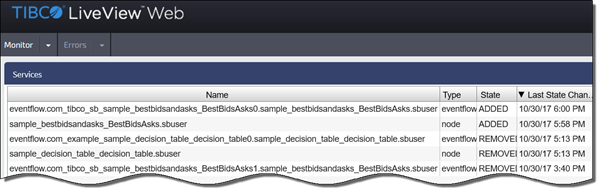
LiveView Web displays cluster statistics using the following set of LiveView Web cards:
| Services |
| Percentage of Shared Memory in Use |
| Host Machine CPU Utilization |
| Node Transaction Rate and Average Latency |
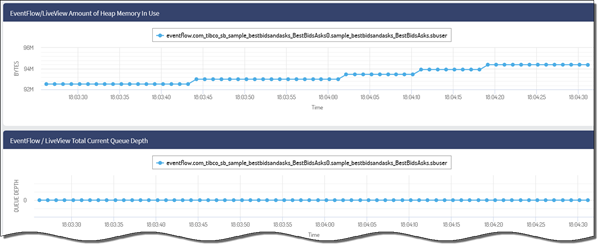
| EventFlow/LiveView Amount of Heap Memory In Use |
| EventFlow/LiveView Total Queue Depth |
Look for output similar to the following in LiveView Web, depending on the LiveView Web card selected:
 |
 |
The following monitoring behavior parameters are configurable:
-
Service discovery
-
Credentials for statistics collection
-
Administration commands
-
Table naming
-
Table aging
-
LiveView listener port
You can change the Cluster Monitor application's configuration:
-
At node or application installation time by replacing the default node.conf configuration file, using the
nodedeployname-value pair in thenodeHOCON configuration file. Thenode.conffile is located in thecluster-monitor.zipfile. -
While the Cluster Monitor is running, by loading and activating a service discovery adapter configuration, a cluster monitor configuration or both.
After activating a new configuration, restart the Cluster Monitor application with the following command:
epadmin servicename=MONITOR_NODE_NAME restart container engine=cluster-monitor
Note
Replace MONITOR_NODE_NAME with the name of the node where the Cluster Monitor application is installed.
The Cluster Monitor contains a Services table showing services that were discovered, including their current state. All other tables are dynamically created and contain the same first three columns:
-
service: The service name.
-
id: A generated per-row unique identifier. This is the primary index.
-
time: A time stamp for the row.
The following statistics tables are configured by default:
-
StreamBaseInfo
-
NodeInfo
Any epadmin target command that generates output may be used. For example, the preconfigured NodeInfo table is equivalent to the following epadmin command:
epadmin servicename=monitor.sb10 display history seconds=1
By default, the generated table name for epadmin commands is t_COMMAND_TARGET. For the command shown above, this becomes t_display_history. This may be changed via configuration.
The first three columns are common to both epadmin command tables and the StreamBaseInfo table.
The remaining columns consist of the epadmin command output. The output column names are discovered and converted to meet LiveView column name requirements:
-
A leading c_ prefix is inserted.
-
Non alpha-numeric characters are converted to underscores.
-
Multiple underscore sequences are converted to single underscores.
For example, the column name: Shared Memory Size (bytes), is converted to: c_Shared_Memory_Size_bytessec.
The Cluster Monitor application attempts to connect to each discovered service, authenticating each using the configured credentials.
The epadmin commands use the administrationAuthentication section of the ClusterMonitor configuration file, as shown in Runtime ClusterMonitor Configuration. By default, no credentials are configured. The application is only able to monitor services running on the local node, started
by the same user who installed the Cluster Monitor.
The configuration supports a single set of credentials for epadmin commands, and a single set of credentials for EventFlow and LiveView services. For simplicity, TIBCO recommends configuring a common login credential throughout the target cluster.
To configure EventFlow and LiveView services information, use the EventFlow section of the ClusterMonitor configuration.