Contents
The Cluster Monitor application is a ready-to-run and configurable StreamBase Application that can be used to monitor the performance of clusters and nodes in a StreamBase Runtime fabric. The application consists of a StreamBase monitoring EventFlow fragment and a LiveView server fragment. The application:
-
Dynamically discovers cluster elements (nodes, JVMs).
-
Dynamically discovers changes to the cluster population.
-
Provides StreamBase performance data for EventFlow and LiveView JVMs.
-
Provides StreamBase Runtime performance data for nodes.
-
Publishes results into a set of LiveView tables.
-
Provides a set of LiveView Web cards that present a customizable view of the data.
Using the default configuration, the LiveView server automatically enables LiveView Web as the client to display cluster monitoring data.
Note
The Cluster Monitor application must be run in a separate cluster from the one containing the applications being monitored.
-
Run the epadmin install node command to enter a node name where you are installing the Cluster Monitor application. For example,
monitor..monitorCluster-
On Windows, you must use a StreamBase Command Prompt.
-
On macOS and Linux, you must use a shell with a StreamBase-ready environment, as described in StreamBsae-Configured Shells.
The epadmin install node command example below wraps to the next lines for clarity but must be entered as one command:
epadmin install node nodename=monitor.
monitorCluster-–substitutions="NODE_NAME=monitor.monitorCluster" -–application=$TIBCO_EP_HOME/distrib/tibco/sb/applications/cluster-monitor.zip -
-
Start the node. Run:
epadmin -–servicename=monitor.
monitorClusterstart node -
Verify the LiveView server is now active. Look for the following message in the
monitor.file to confirm the LiveView server is active:monitorCluster/logs/liveview-server.log*** All tables have been loaded. LiveView is ready to accept client connections.
You can use epadmin tail logging command to watch the log file:
epadmin --servicename=monitor.
monitorClustertail logging --enginename=liveview-serverSee the Tail Logging for details regarding the epadmin logging target.
Once the node is started and the Cluster Monitor application is running, open a browser to view cluster data for the started node (at least one node must be installed to view any meaningful data in LiveView Web).
Enter: http://localhost:11080/lvweb. The Cluster Monitor application uses 11080 as its default LiveView Web port, to avoid conflicts with the standard LiveView
Web port, 10080.
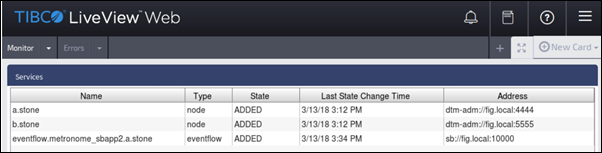
LiveView Web displays cluster statistics using the following set of LiveView Web cards:
- Services
-
Discovered Services.
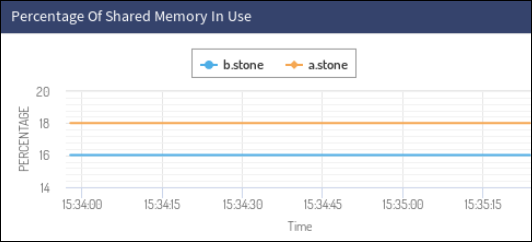
- Percentage of Shared Memory in Use
-
Amount of shared memory in use, per node.
- Host Machine CPU Utilization
-
CPU utilization, per node host machine. Note that multiple nodes running on a single host will report the same information.

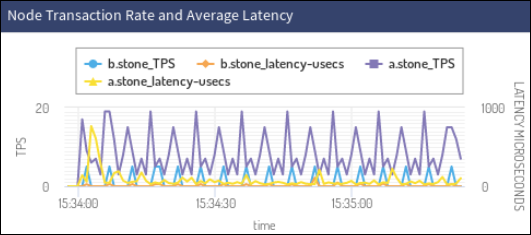
- Node Transaction Rate and Average Latency
-
The transaction rate and average latency, per node.
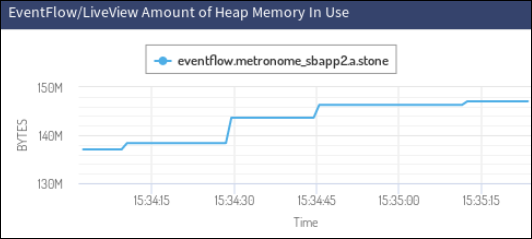
- EventFlow/LiveView Amount of Heap Memory In Use
-
The amount of Java heap memory in use, per EventFlow/LiveView engine.
- EventFlow/LiveView Total Queue Depth
-
The total queued tuple depth per EventFlow/LiveView JVM.
The following monitoring behavior parameters are configurable:
-
Service discovery
-
Credentials for statistics collection
-
Administration commands
-
Table naming
-
Table aging
-
LiveView listener port
You can change the Cluster Monitor application's configuration:
-
At node/application installation time by replacing the default node deploy configuration using the
nodedeployparameter in the defaultnode.conffile. The Cluster Monitor application's defaultnode.conffile is located in thecluster-monitor.zipfile. See below to learn more about thenode.conffile's properties. -
While the Cluster Monitor application is running by loading and activating a Service Discovery adapter configuration, a Cluster Monitor configuration, or both. See:
-
Runtime ClusterMonitor Configuration for individual Cluster Monitor configuration property details.
-
Runtime Service Discovery Configuration for individual Service Discovery adapter configuration property details.
-
After activating a new configuration, restart the Cluster Monitor application with the following command:
epadmin -–servicename=MONITOR_NODE_NAME restart container -–engine=cluster-monitor
Note
Replace MONITOR_NODE_NAME with the name of the node where the Cluster Monitor application is installed.
The Cluster Monitor configures the following statistics tables by default:
Services Table: The monitor always contains a Services table showing services that have been discovered and their current state.
| Field Name | Type | Notes |
|---|---|---|
| serviceState | string | |
| serviceName | string | Primary key |
| serviceAddress | string | Approves or rejects artifacts committed by other users |
| serviceChangeTime | timestamp |
StreamBaseInfo Table: EventFlow/LiveView server Java heap memory use, and aggregate total number of queued tuples.
| Field Name | Type | Notes |
|---|---|---|
| service | string | |
| id | long | Primary key. Per row unique identifier. |
| time | timestamp | |
| usedMemory | long | Bytes |
| totalQueueDepth | long |
NodeInfo Table: Per node shared memory usage, transaction rate, and deadlock counter, and CPU usage for the machine where the node is running.
| Field Name | Type | Notes |
|---|---|---|
| service | string | |
| id | long | Primary key. Per row unique identifier. |
| time | timestamp | |
| c_Version | long | History command output version |
| c_Shared_Memory_Total | long | Bytes |
| c_Shared_Memory_Used | long | Percentage |
| c_CPU_Percent_User | long | Percentage |
| c_CPU_Percent_System | long | Percentage |
| c_CPU_Percent_Idle | long | Percentage |
| c_Transactions during the last sample | long | Number of per node transactions |
| c_Average_Transaction_Latency_usecs | long | Average transaction length |
| c_Transaction_Deadlocks | long |
Any epadmin target command that generates output may be used. For example, the NodeInfo table is equivalent to the following epadmin command:
epadmin --servicename=monitor.monitorCluster display history --seconds=1By default, the generated table name for epadmin commands is t_COMMAND_TARGET. For the command shown above, this becomes t_display_history. This may be changed via configuration.
The first three columns are common to both epadmin command tables and the StreamBaseInfo table.
The remaining columns consist of the epadmin command output. The output column names are discovered and converted to meet LiveView column name requirements:
-
A leading c_ prefix is inserted.
-
Non alpha-numeric characters are converted to underscores.
-
Multiple underscore sequences are converted to single underscores.
For example, the column name: Shared Memory Size (bytes), is converted to: c_Shared_Memory_Size_bytessec.
The Cluster Monitor application attempts to connect to each discovered service, authenticating each using the configured credentials.
The epadmin commands use the administrationAuthentication section of the ClusterMonitor configuration file, as shown in Runtime ClusterMonitor Configuration. By default, no credentials are configured. The application is only able to monitor services running on the local node, started
by the same user who installed the Cluster Monitor.
The configuration supports a single set of credentials for epadmin commands, and a single set of credentials for EventFlow and LiveView services. For simplicity, TIBCO recommends configuring a common login credential throughout the target cluster.
To configure EventFlow and LiveView services information, use the EventFlow section of the ClusterMonitor configuration.
//
// Default configuration for the StreamBase Cluster Monitor.
//
// To change this configuration, make a copy of this entire file
// and use the nodedeploy option to epadmin install node.
//
// HOCON substitution variables used in this configuration:
//
// NODE_NAME Required. The name of the node that the monitor application is
// installed to (the nodename parameter to epadmin install node).
//
// LIVEVIEW_PORT Defaults to 11080
//
// These variables may be overridden via the substitutions or substitutionfile
// parameters to epadmin install node.
//
name = "ClusterMonitor"
version = "1.0"
type = "com.tibco.ep.dtm.configuration.node"
configuration =
{
NodeDeploy =
{
nodes =
{
"${NODE_NAME}" =
{
description = "Node for running the ClusterMonitor"
engines =
{
"cluster-monitor" =
{
fragmentIdentifier = "com.tibco.ep.cluster.eventflow"
configuration =
[
"""
name = "cluster-monitor-service-discovery"
version = "1.0.0"
type = "com.tibco.ep.streambase.configuration.servicediscoveryadapter"
configuration =
{
ServiceDiscovery =
{
associatedWithEngines = [ "cluster-monitor" ]
//
// The port to use for discovery requests.
// Optional. Defaults to the port being used by the node where
// this configuration is loaded.
//
// discoveryPort = 54321
//
// A list of host names that specify which network interfaces
// to use when sending discovery requests.
// Optional. Defaults to the system's host name.
discoveryHosts = [ ]
//
// Service names that will be discovered by the cluster monitor.
// Optional. Defaults to all service names found.
// Uncomment to restrict.
//
// serviceNames = [ "cluster1", "cluster2", "nodeA.cluster3" ]
//
// Service types that will be discovered by cluster monitor.
// Optional. Empty defaults to all service types, but the cluster
// monitor only knows how to monitor node, eventflow and
// liveview services.
//
serviceTypes = [ "node", "eventflow", "liveview" ]
//
// The number of seconds between discovery requests.
// Optional. Defaults to 1.
//
// discoveryBrowseIntervalSeconds = 1
//
// This causes the cluster-monitor event flow application
// to wait for the LiveView server to become ready before
// starting. Do not change.
//
autostart = false
//
// Whether or not services running within the monitor's node
// are discovered and monitored.
// Defaults to false.
//
includeLocalServices = ${INCLUDE_LOCAL_SERVICES:-false}
}
}
""",
"""
name = "clustermonitor"
version = "1.0.0"
type = "com.tibco.ep.streambase.configuration.clustermonitor"
configuration =
{
ClusterMonitor =
{
associatedWithEngines = [ "cluster-monitor" ]
//
// A list of administration commands to run against discovered
// node services, every collection interval, and then publish
// to LiveView server tables.
//
commands =
[
{
//
// Administration command name. Required.
//
commandName = "display"
//
// Administration target name. Required.
//
targetName = "history"
//
// A list of command parameters. Optional.
//
parameters =
{
"seconds" = "1"
}
//
// The name of the LiveView table for the command results.
// This name must be a legal LiveView table name, starting
// with a letter, followed by a combination of letters, digitis,
// and underscores. Whitespace is not allowed.
//
// Optional. Will default to "t_commandName_targetName"
//
tableName = "NodeInfo"
//
// Number of seconds between command invocations.
// Optional. Defaults to 1.
//
collectionIntervalSeconds = 1
},
// Additional commands may be added here.
]
//
// Age limit for data rows in the monitor tables.
// Optional. Defaults to 60.
//
// rowAgeLimitSeconds = 60
//
// The interval at which tables are checked for removing old rows.
// Optional. Defaults to 30.
//
// rowCheckIntervalSeconds = 30
//
// Optional credentials for running the administration commands.
//
// administrationAuthentication =
// {
// //
// // The user name to use when connecting to the node.
// //
// userName = "administrator"
// //
// // The password to use when connecting to the node.
// //
// password = "This is a plain text password"
// }
//
// Optional credentials for collecting StreamBase statistics.
//
// eventFlowAuthentication =
// {
// //
// // The user name to use when connecting to the
// // EventFlow or LiveView StreamBase listener.
// //
// userName = "sbAministrator"
// //
// // The password to use when connecting to the
// // EventFlow or LiveView StreamBase listener.
// // A value beginning with '#!' is enciphered
// // with the sbcipher tool.
// //
// password = "#!xyzzy"
// }
}
}
""",
"""
name = "cluster-monitor-operator-parameters"
version = "1.0.0"
type = "com.tibco.ep.streambase.configuration.sbengine"
configuration =
{
StreamBaseEngine =
{
streamBase =
{
operatorParameters =
{
LIVEVIEW_PORT = ""${LIVEVIEW_PORT:-11080}
}
}
}
}
"""
]
}
"liveview-server" =
{
fragmentIdentifier = "com.tibco.ep.cluster.liveview-server"
configuration =
[
"""
name = "liveview-server-listener"
type = "com.tibco.ep.ldm.configuration.ldmclientapilistener"
version = "1.0.0"
configuration =
{
ClientAPIListener =
{
associatedWithEngines = [ "liveview-server" ]
portNumber = ${LIVEVIEW_PORT:-11080}
}
}
""",
"""
name = "liveview-sb-listener"
type = "com.tibco.ep.streambase.configuration.sbclientapilistener"
version = "1.0.0"
configuration =
{
ClientAPIListener =
{
associatedWithEngines = [ "liveview-server" ]
apiListenerAddress =
{
portNumber = 0
}
}
}
""",
"""
name = "liveview-server-engine"
version = "1.0.0"
type = "com.tibco.ep.ldm.configuration.ldmengine"
configuration = {
LDMEngine = {
//
// Recommended JVM 1.8 flags for LiveVew
//
jvmArgs =
[
"-Xmx4g"
"-Xms1g"
"-XX:+UseG1GC"
"-XX:MaxGCPauseMillis=500"
"-XX:ConcGCThreads=1"
]
systemProperties = {
"liveview.web.pstore.type" = "h2"
}
ldm = {
}
}
}
"""
]
}
}
}
}
}
}