StreamBase fragment engines are JVMs instrumented with a JMX-compliant Managed Bean that provides access to status information and provides a limited set of control methods similar to the legacy sbadmin command. This allows the StreamBase fragment engines to be visible to JMX-compliant network management tools such as Java JConsole or HP Openview.
The JConsole utility is provided as part of the Oracle JDK bundled with StreamBase. We are using JConsole on this page only as a freely available example of a JMX-compliant network management tool, not as the recommended tool to use. Your site's administrators may already use a commercial network management suite. If it is JMX-compliant, then all running StreamBase JVM engines should appear in that tool's list of running applications.
If your site uses an SNMP-based management tool, consider adopting one of the several available JMX to SNMP bridge packages, both commercial and open source.
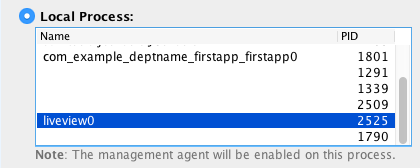
Start JConsole by typing jconsole in a StreamBase Command Prompt or type jconsole & in a macOS or Linux Terminal window on the same machine running your EventFlow fragments. JConsole starts with a dialog that
prompts you to select one of the running Java processes on the local machine.
Running Java processes are listed by their primary class names. EventFlow fragments run with a clearly named JVM engine based on the primary EventFlow module. Select one of the named JVMs named to monitor.
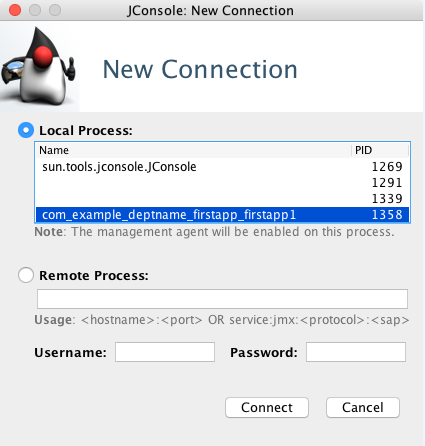 |
Each EventFlow or LiveView fragment runs with an unnamed companion JVM engine that handles node management tasks. The other unnamed JVM in the image above is the one running StreamBase Studio. Unnamed JVMs are not instrumented for JMX compliance.
Remember that when you stop a fragment in Studio, it leaves the node installed and started. Such nodes appear in the JConsole list as a grayed-out entry showing only its process ID:
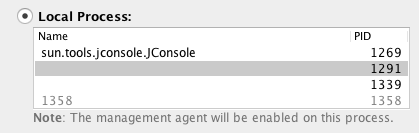 |
When Studio runs multiple fragments, it gives each fragment a unique JVM engine name:
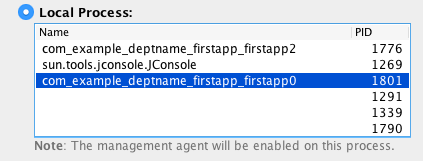 |
Studio assigns LiveView fragments a simple engine name instead of a class name:
 |
To assign a specific engine name to run a fragment launched with the epadmin command, use a configuration file of type com.tibco.ep.dtm.configuration.node.
To connect to an EventFlow or LiveView engine running on another machine, first determine its JMX Service Address. First, retrieve the remote node's administration port for the node of interest:
epadmin display services servicetype=node
Then use command like the following to retrieve the JMX port of the remote node:
epadmin hostname=hostnameadminport=portnumberdisplay engine
You can use an IP address for the hostname parameter. The specified hostname must be reachable with ping from your current machine.
Once you have the JMX port of the remote node, use that port with the machine's pingable URI. You can use the default StreamBase
Runtime node credentials guest, password guest.
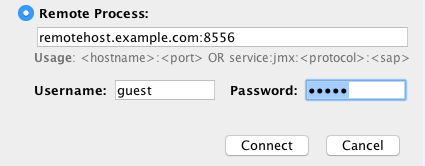 |
The return from the display engine command also includes a full JMX service URI that you can use in the remote process field. You still need to specify the StreamBase Runtime node credentials.
service:jmx:rmi:///jndi/rmi://remotehost.example.com:8556/jmxrmi
Once connected to an EventFlow or LiveView fragment's JVM engine, use the tabs in the JConsole window to view status information. The following tabs may be of special interest to StreamBase users:
- Memory
-
Use the Memory tab to see a real time analysis of the memory usage and garbage collection activity of the JVM that is hosting the fragment.
- VM Summary
-
The VM Summary tab shows the VM arguments with which the server started and its classpath, among other statistics. Use this information to troubleshoot startup issues.
- MBeans
-
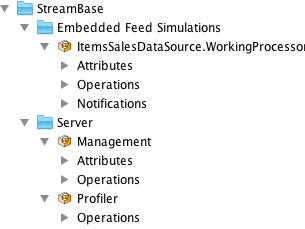
Use this tab to view status information and send administration commands as allowed by the engine's Managed Bean. In JConsole, the relevant portion of the MBeans tab for EventFlow fragments is like the following example:
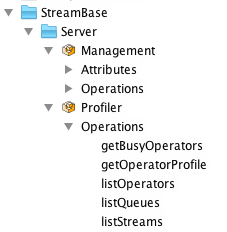
Click each Attribute node in turn and click to see current status for the specified area.
Not all Operations commands are active. If an Operation page has an active button, then the server's MBean supports that operation. For example, click the
suspendcommand, type a container name in your running application, such asdefault, and click the button. To resume that container, use analogous steps in theresumenode.The following Operations commands in the Server Management bean have active buttons: shutdown, resume, suspend, leadership, killConnection, getDynamicVariable, and statusOperator.
All Operations in the Server Profiler bean have active buttons.
The MBeans tab for a LiveView fragment might show a separate entry for a companion EventFlow engine that runs alongside the LiveView engine. For example: