OVER expressions can be used in calculated columns when you want to split the results in a calculated column into separate, fixed, values for different groups, instead of obtaining one result for the entire column. Calculated columns are always calculated on all values in the column, no matter how you filter your data.
When working with calculated columns, there are no axes available to navigate over, as in the case with custom expressions. Instead, you use the over expressions to refer to values in a column or a hierarchy, and calculate one result for each value in the column or hierarchy.
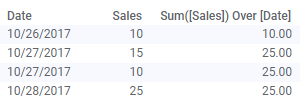
For example, if you have multiple sales transactions each day, you could use 'OVER' to aggregate those values into one value for each day, (Sum([Sales]) OVER [Date]):
Note that the resulting value for each group will be shown on all rows that were included in that calculation (smearing). This means that it is probably not suitable to use such a calculated column in aggregating visualizations (for example, to show in a bar chart). See also Aggregations in Expressions for more information.
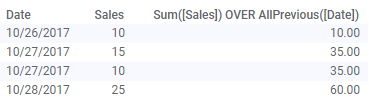
By combining OVER with functions such as All, AllPrevious, LastPeriods, etc., you can obtain just about any type of grouped values. For example, the expression Sum([Sales]) OVER AllPrevious([Date]) will give you the cumulative sum of sales for all dates in the column 'Date'.
If you want subgroups for the results to be defined by values in more than one column, and the values from either of those columns make use of any of the OVER functions, then you must also use the Intersect function. For example, look at the example Sum([Oil Production]) OVER Intersect([Well ID], AllPrevious([Year])). To be able to obtain the cumulative oil production per well and year, we need to intersect the well and year.
When you are referring to a hierarchy within an expression, the nodes in that hierarchy become similar to the nodes on an axis (compare to custom expressions), and you can specify which nodes to compare using functions such as All, Previous, Parent, etc. Hierarchies are referenced in expressions using the syntax 'Hierarchy.HierarchyName'. For example, with a hierarchy called 'TimeHierarchy', containing Year and Quarter, the expression Sum([Sales]) OVER (Parent([Hierarchy.TimeHierarchy])) would return the sum of sales per year.
Examples of calculated columns
Example |
Expression |
Average sales per category and year |
Avg([Sales]) OVER ([Category], [Year]) |
Average sales per category for all years, up until the current year |
Avg([Sales]) OVER Intersect([Category], AllPrevious([Year])) |
Peak oil per well |
Max([Oil Production]) OVER ([Well ID]) |
Cumulative oil production per well |
Sum([Oil Production]) OVER Intersect([Well ID], AllPrevious([Year])) |
Sum of sales for top level of a hierarchy |
Sum([Sales]) OVER (Parent([Hierarchy.TimeHierarchy])) |