 .
.If you are working with in-memory data, you can add rows from a different source to your current data table. Data can be added from a local file, a data file previously saved in the library, from imported data connections, from information links, or, from the clipboard.
Even though data from different data tables often can be viewed in the same visualization, it may be preferred to actually incorporate similar data into a single data table. For example, if all columns are the same in the data sources and you know that you want to use summarized values from all sources in your visualization.
You add data from the Files and data
flyout .
When you add data into your analysis, you can select to add the data as new rows in another data table, from the final step in the add data workflow (the summary view):
To insert rows into a specific place in a data table:
On the authoring bar, click
Data canvas ![]() .
.
From the drop-down list in the upper-left part of the Data canvas, select the data table in which to add rows.
In the source view, click the
plus sign between the nodes where you want to insert rows.
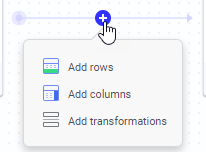
Click Add rows.
In the Files and data flyout, locate the data to add by searching for a suitable keyword or by browsing the different categories.
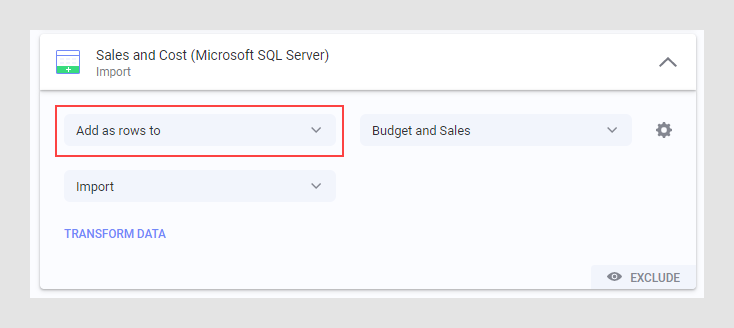
In the summary view, click on the new data to enable editing and click the settings icon to configure how to match columns between the two data sets.
In the Add rows – match columns
dialog, verify that the suggested column matching is valid, or edit
the matching as desired. This is done by adding or removing matches
between columns From original data and
From new data.
Click on the plus sign and select a column from the list to add a match
for one of the columns from the original data. Click on the x on a
row to remove a match.
Tip: When adding rows, you will append new rows to the original data table. This means that you should probably try to match as many columns as possible.
Optionally, if there are additional columns in the added data, you can select to include or skip these columns under Include additional columns from new data by selecting or clearing the check box for each column.
Comment: Note that if the data source from which columns were added can be reloaded, and new columns become available after a reload, then the new columns will automatically become included. If this was not desired, you may want to exclude new columns after reloading data by editing the settings for added rows.
Optionally, change the settings under Identify origin of rows.
Comment: Select Do not identify origin to skip this option, Create new column to add a new column with different values for data from the original source and data from the added source, or select Use existing column to add this information to an existing column.
When you are done, click OK.
Optionally, click Transform data to apply transformations on the new source data.
Comment: See Transforming Data to learn more.
Click OK.
Response: The rows are added to your data table.