Option |
Description |
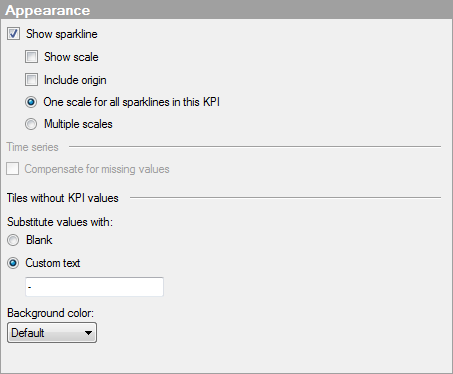
Show sparkline |
Select this check box to include sparklines in the tiles in this KPI. A sparkline shows the trend over time for the variable specified on the Value axis. |
Show scale
|
Select this check box to supplement the sparklines in this KPI with a vertical scale. The scale ranges from the bottom value to the top value of the variable specified on the Value axis. However, it is possible to always include origin, see below. |
Include origin
|
Select this check box to always include the value 0 in the scale range. |
One scale for all sparklines in this KPI
|
Select this option if you want to use a common sparkline scale within the KPI tiles.
|
Multiple scales
|
Select this option if you want to use different scales for the sparklines within this KPI. For example, it can be useful if the data to present in the different sparklines is of very different magnitudes, and you are, in the first place, interested in seeing the trend for each tile category. |
Time series |
|
Compensate for missing values |
Select this check box if a Date, Time, or DateTime column is used on the time axis of the KPI, and there are instances in the time series which are missing. When this check box is selected, the missing time values will be inserted on the axis, and the corresponding values for other axes will be empty values. For example, if the Value axis should show the most recent value and its corresponding time value is missing, selecting this check box will lead to (Empty) being displayed in the tile. If the check box is not selected, the value for the last available time period will be displayed. See Working With Time Hierarchies for more information. |
Tiles without KPI values |
If you, in the Advanced Settings dialog for the Tile by axis, select Show all values, you might under certain circumstances get tiles that have no primary and comparative values to display. This might be the case when tile categories have been filtered out, or certain combinations in a hierarchy do not exist. |
Substitute values with |
Specify what to display as substitution for non-existent KPI values. |
Blank |
Select this option to leave the primary and comparative values unfilled. |
Custom text |
Select this option to display custom text instead of the primary and comparative values. You type what to display in the text field. |
Background color |
In the drop-down color palette, select the background color to use for the tiles without KPI values. |