You can specify your own display name for an axis.
About this task
The display name
can be changed for any axis, for example, the X-axis, the Y-axis, or the Color
axis.
Procedure
-
In the column selector on the axis, click the arrow next to the
column name.
A popover opens that shows which column and aggregation
are selected on the axis.
-
In the field at the bottom of the popover, enter the wanted
display name and press Enter.
The new display name becomes visible on the axis.
-
Click outside the popover to close it.
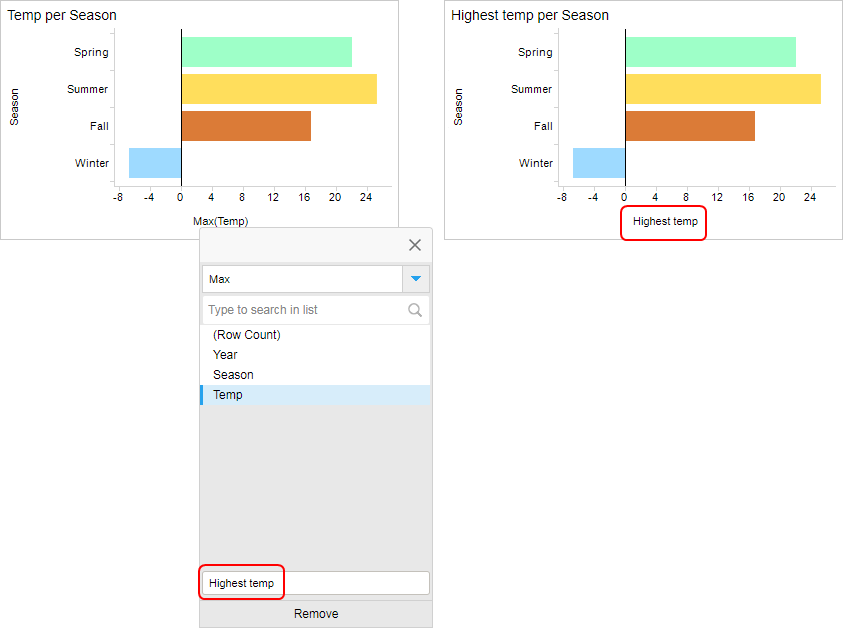
Example
In the bar chart below, the display name on the Value axis is changed
from Max(Temp) to Highest temp. The visualization title adjusts automatically.