Changing the formatting of a column
The formatting of a column defines how the data in the column will be presented. For example, depending on how you format a date column, the dates therein can be shown as "01/12/2022" or "January 12th, 2022". When you define formatting at the column level (in the Data in analysis flyout), this is the default formatting that will be used at all places where the column content is shown.
Before you begin
About this task
Procedure
-
On the
authoring bar, click
Data in analysis
 and click on the column of
interest.
and click on the column of
interest.
-
In the expanded flyout,
make sure that
Details on selected column
 is selected.
-
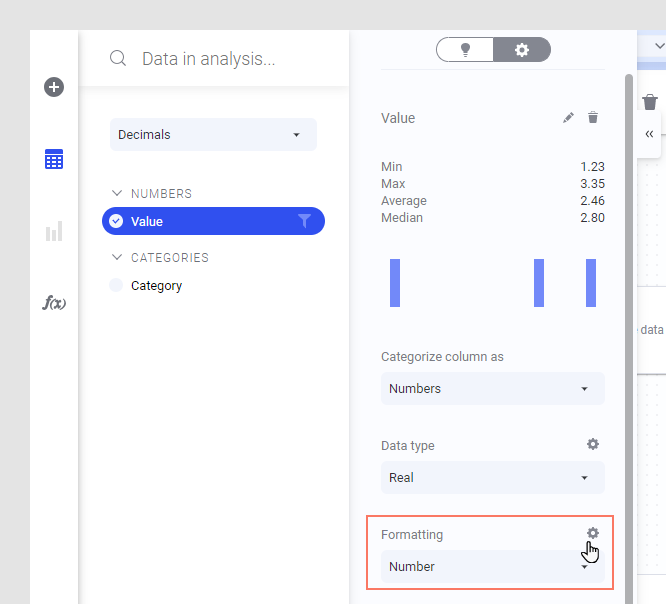
In the expanded flyout, locate the
Formatting section and either change the
formatting to a different type directly from the drop-down list or click
Settings
 , and make further modifications in the
Formatting settings dialog as described below.
, and make further modifications in the
Formatting settings dialog as described below.
Results
Example: Changing the number of decimals
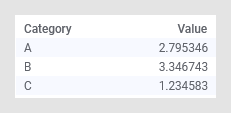
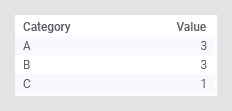
If your data contains measures with many decimals, like the values below, but you are interested in displaying integers only, you can change the default formatting so no decimals are shown.
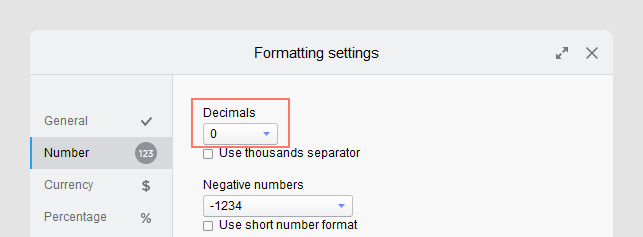
Show the
Formatting settings dialog from the expanded
Data in analysis flyout by clicking
Settings
.
Then change the number of decimals to zero.
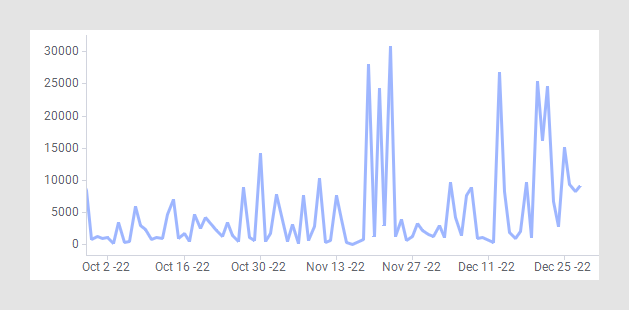
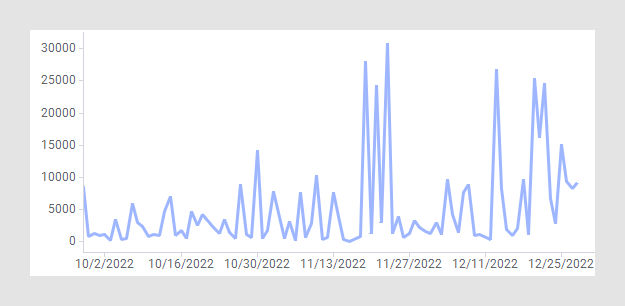
The visualization now shows the values without any decimals:
Example: Defining a custom format for a date column
With custom formatting you can specify exactly how you want a value to be presented. This example shows how you can define a custom format for a date column.
Which predefined formats are available for a date or time column depends on the language setting on your computer.
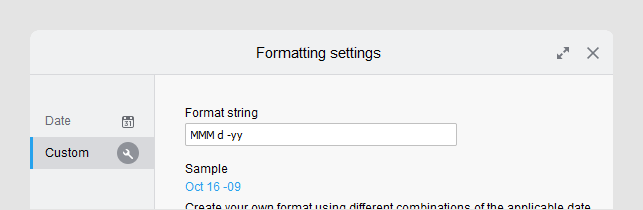
If you want to define your own format, in the Formatting settings dialog, click Custom and type the format string that specifies your format. In this example, a short format of the month name is shown, together with the day, expressed as a number, and short year: MMM d -yy. See Custom formatting of date and time columns for more details about custom formats.
Click OK and see the result in the visualization: