Guia do Usuário do Cliente Web Spotfire®

Marking items using the legend

You can mark items of a certain category using the legend in a visualization.

About this task

The legend displays settings made on various axes. An example of an axis is the Color axis, where each specified color represents a certain category. By clicking a category on an axis, you mark all items within that category.
For example, in the scatter plot below, the Color axis is used to mark all items in the "group d" category, that is, all yellow items. The other categories, "group a-c" and "group e", are grayed out in the legend to indicate that only the "group d" is marked.
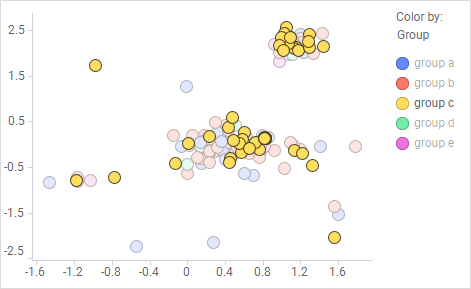
Marking from legend
Note: The legend cannot be used to mark items on axes with numerical data. Only categorical data on the following axes can be marked: the color, shape and series axes.

Procedure

  1. In the legend, move the cursor over the axis category whose items you want to mark.
    A dotted line appears beneath the category if it can be used for marking.
  2. Click a category to mark all its items.
    Note: Click the category text, not the symbol.
    You can press Ctrl + click a category to mark more than one category. The categories can be selected on a single axis, or on different axes.