Statistical functions
The list shows the statistical functions that you can use in expressions.
| Function | Description |
|---|---|
Avg(Arg1, ...)
|
Returns the average (arithmetic mean) of the
arguments. The arguments and the result are of type real. If one argument is
given, then the result is the average of all rows. If more than one argument is
given, then the result is the average for each row. Null arguments are ignored
and do not contribute to the average.
Examples:
|
ChiDist(Arg1)
|
Returns the (upper tail) chi-square p-value
of the argument.
Example:
|
ChiInv(Arg1)
|
Returns the (upper tail) chi-square quantile
value of the argument.
Example:
|
Count(Arg1)
|
Calculates the number of non-empty values in
the argument column, or, if no argument is specified, the total number of rows.
Example:
|
CountBig(Arg1)
|
Calculates the number of non-empty values in
the argument column, or, if no argument is specified, the total number of rows.
This function returns a LongInteger.
Example:
|
Covariance(Arg1,
					 Arg2)
|
Calculates the covariance of two columns
given as arguments.
Example:
|
FDist(Arg1)
|
Returns the upper tail F p-value of the
argument.
Example:
|
FInv(Arg1)
|
Returns the upper tail F quantile value of
the argument.
Example:
|
First(Arg1)
|
Returns the first valid value based on the
physical order of the rows of data in the argument column.
Example:
|
GeometricMean()
|
Calculates the geometric mean value. If any
input value is negative then the result will be "Empty". If any input value is
equal to zero then the result will be zero.
Example:
|
IQR(Arg1)
|
Calculates the value difference Q3-Q1, or,
the 75th percentile minus the 25th percentile. IQR is also referred to as the
H-spread.
Example:
|
L95(Arg1)
|
Calculates the lower endpoint of the 95%
confidence interval.
Note: The static
t-value of 1.959964, used by this function, is adapted for large sample sizes
(
n >= 40). For smaller sample sizes, use the following
expression instead:
Example:
|
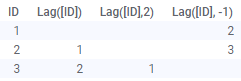
Lag(Arg1,
					 Arg2)
|
Shifts the values in a column downward by a
specified number of steps. The first argument is the column to shift. The
second (optional) argument is the number of steps. Default is 1.
If a negative number of steps is used, then the values are shifted in the opposite direction, see image below. Examples:
Note that the Lag function is applied to the data in the order the data was loaded; the function does not take sorting in visualizations into account and any changes to the data (e.g., during reload) might result in different values for the various rows. |
Last(Arg1)
|
Returns the last valid value based on the
physical order of the rows of data in the argument column.
Example:
|
LastValueForMax(Arg1,
					 Arg2)
|
Returns the value of column 2 for the
maximum value of column 1.
If there are more than one of the column 1 maximum value, then
the result will be the value for the last max row. See also
Example:
|
LastValueForMin(Arg1,
					 Arg2)
|
Returns the value of column 2 for the
minimum value of column 1.
If there are more than one of the column 1 minimum value, then
the result will be the value for the last min row. See also
Example:
|
LAV(Arg1)
|
Calculates the lower adjacent value.
Example:
|
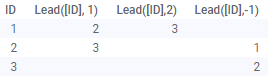
Lead(Arg1,
					 Arg2)
|
Shifts the values in a column upward by a
specified number of steps. The first argument is the column to shift. The
second (optional) argument is the number of steps. Default is 1.
If a negative number of steps is used, then the values are shifted in the opposite direction, see image below. Examples:
Note that the Lead function is applied to the data in the order the data was loaded; the function does not take sorting in visualizations into account and any changes to the data (e.g., during reload) might result in different values for the various rows. |
LIF(Arg1)
|
Calculates the lower inner fence. This is
the threshold located at
Q1 - (1.5*IQR).
Example:
|
LOF(Arg1)
|
Calculates the lower outer fence. This is
the threshold located at
Q1 - (3*IQR).
Example:
|
Max(Arg1, ...)
|
Calculates the maximum value. If one
argument is given, then the result is the maximum for the entire column. If
more than one argument is given, then the result is the maximum for each row.
The argument and the result are of type real. Null arguments are ignored.
Examples:
|
MeanDeviation(Arg1, ...)
|
Calculates the mean deviation value (average
absolute deviation, AAD). If one argument is given, then the result is the mean
deviation of all rows. If more than one argument is given, then the result is
the mean deviation for each row.
Examples:
|
Median(Arg1)
|
Calculates the median of the argument. If
one argument is given, then the result is the median of all rows. If more than
one argument is given, then the result is the median for each row.
Examples:
|
MedianAbsoluteDeviation(Arg1,
					 ...)
|
Calculates the median absolute deviation
(MAD). If one argument is given, then the result is the median absolute
deviation of all rows. If more than one argument is given, then the result is
the median absolute deviation for each row.
Examples:
|
Min(Arg1,
					 ...)
|
Calculates the minimum value. If one
argument is given, then the result is the minimum for the entire column. If
more than one argument is given, then the result is the minimum for each row.
The argument and the result are of type real. Null arguments are ignored.
Examples:
|
NormDist(Arg1)
|
Returns the (upper tail) normal p-value of
the argument. If you do not specify them yourself, the default is mean=0 and
standard deviation=1.
Example:
|
NormInv(Arg1)
|
Returns the (upper tail) normal quantile
value of the argument. If you do not specify them yourself, the default is
mean=0 and standard deviation=1.
Example:
|
NthLargest(Arg1,
					 Arg2)
|
The nth largest value. The first argument is
the column to analyze and the second argument is the value of n.
If n is larger than the number of values in the column, then the smallest value is returned. Example:
|
NthSmallest(Arg1,
					 Arg2)
|
The nth smallest value. The first argument
is the column to analyze and the second argument is the value of n.
If n is larger than the number of values in the column, then the largest value is returned. Example:
|
Outliers(Arg1)
|
Outer value count. Calculates the count of
values that are greater than the upper adjacent value or lower than the lower
adjacent value.
Example:
|
P10(Arg1)
|
The 10th percentile is the value at which 10
percent of the data values are equal to or lower than the value.
Example:
|
P90(Arg1)
|
The 90th percentile is the value at which 90
percent of the data values are equal to or lower than the value.
Example:
|
PctOutliers(Arg1)
|
Outer value percentile. Calculates the
percent of values that are greater than the upper adjacent value or lower than
the lower adjacent value.
Example:
|
Percent(Arg1,
					 Arg2)
|
The percent is the value calculated a
certain percent above the minimum value within the value range (max value - min
value). The first argument is the column to analyze and the second argument is
the percent.
Example:
|
Percentile(Arg1,
					 Arg2)
|
The percentiles is the value at which a
certain percent of the data values are equal to or lower than the value. The
first argument is the column to analyze and the second argument is the percent.
Example:
|
Q1(Arg1)
|
Calculates the first quartile.
Example:
|
Q3(Arg1)
|
Calculates the third quartile.
Example:
|
Range(Arg1)
|
The range between the largest and the
smallest value in the column.
The result will be presented as a real or a timespan, depending on the data type of the argument. Example:
|
StdDev(Arg1)
|
Calculates the standard deviation.
Example:
|
StdErr(Arg1)
|
Calculates the standard error.
Example:
|
TDist(Arg1)
|
Returns the (upper tail) t p-value of the
argument.
Example:
|
TERR_Binary
|
Calls the Spotfire® Enterprise Runtime for R
(a/k/a TERR™) and returns an output of the specified data type, containing the
same number of rows as the input.
The first argument is a script and the following arguments are the arguments to the script. The column returned must have the same number of rows as the
input. At least one argument other than the script is required. The inputs will
be placed in variables called
Examples:
|
TERR_Boolean
|
See TERR_Binary above. |
TERR_DateTime
|
See TERR_Binary above. |
TERR_Integer
|
See TERR_Binary above. |
TERR_Real
|
See TERR_Binary above. |
TERR_String
|
See TERR_Binary above. |
TERRAggregation_Binary
|
Calls the TERR engine and returns an output
of the specified data type. The first argument is a script and the following
arguments are the arguments to the script.
The script should return a single aggregated value. At least
one argument other than the script is required. The inputs will be placed in
variables called
Examples:
|
TERRAggregation_Boolean
|
See TERRAggregation_Binary above. |
TERRAggregation_DateTime
|
See TERRAggregation_Binary above. |
TERRAggregation_Integer
|
See TERRAggregation_Binary above. |
TERRAggregation_Real
|
See TERRAggregation_Binary above. |
TERRAggregation_String
|
See TERRAggregation_Binary above. |
TInv(Arg1)
|
Returns the (upper tail) t quantile value of
the argument.
Examples:
|
TrimmedMean(Arg1,
					 Arg2)
|
Calculates the trimmed mean value (trimmed
average). The first argument is the column to analyze and the second argument
is, in percent, how many values to exclude from the calculation. If the trim
value is set to 10%, then the highest 5% and the lowest 5% of the values are
excluded from the calculated mean.
Example:
|
U95(Arg1)
|
Calculates the upper endpoint of the 95%
confidence interval.
Note: The static
t-value of 1.959964, used by this function, is adapted for large sample sizes
(
n >= 40). For smaller sample sizes, use the following
expression instead:
Example:
|
UAV(Arg1)
|
Calculates the upper adjacent value.
Example:
|
UIF(Arg1)
|
Calculates the upper, inner fence. This is
the threshold located at
Q3 + (1.5*IQR).
Example:
|
UniqueCount(Arg1)
|
Calculates the number of unique, non-empty
values in the argument column.
Example:
|
UOF(Arg1)
|
Calculates the upper outer fence. This is
the threshold located at Q3 + (3*IQR).
Example:
|
ValueForMax(Arg1,
					 Arg2)
|
Returns the value of column 2 for the
maximum value of column 1.
If there are more than one of the column 1 maximum value,
then the result will be the value for the first max row. See also
Example:
|
ValueForMin(Arg1,
					 Arg2)
|
Returns the value of column 2 for the
minimum value of column 1.
I f there are more than one of the column 1 minimum value,
then the result will be the value for the first min row. See also
Example:
|
Var(Arg1)
|
Calculates the variance.
Example:
|
WeightedAverage(Arg1,
					 Arg2)
|
Calculates the weighted average of two
columns. Arg1 is the weight column and Arg2 is the value column.
Example:
|
Tip: The
DISTINCT keyword can be used to return a result using
the unique values only. For example,
Avg(DISTINCT[Column]) would return
the average of the unique values rather than the average of all values in the
specified column.
UniqueCount([Column]) is the
equivalent of
Count(DISTINCT[Column]).
See also Functions.