Using hierarchy filters
A hierarchy filter represents the data in a hierarchy. The filter consists of an expandable tree view, where the categories within the different levels of the hierarchy are represented by check boxes.
About this task
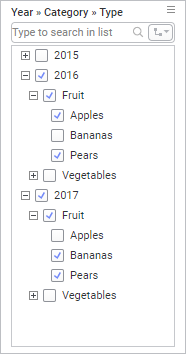
Only rows containing values with selected check boxes remain in the visualization. For example, rows containing 2016, Fruit, and Apples are included in the visualization, but rows containing 2017, Fruit, and Apples are not included in the visualizations.
Note: Values that have
been filtered out by other filters are indicated with gray text.
Combining columns into a hierarchy filter will not automatically
remove all other filters representing the same columns -- this must be done
manually, if desired.
Note: Creating a hierarchy with a very large number of nodes may take a
long time. It may also result in a hierarchy filter with too many check boxes
to be practically useful. Use the Filtering Scheme Properties or the Column
Properties to edit the hierarchy and remove the column with too many unique
values if this happens.
How to create a hierarchy filter is described in Defining hierarchies.
Procedure
Select or clear one or several check boxes to specify on which
values the visualizations should be based.