Data canvas
The Data canvas (the source view) shows how data is added to the analysis, and lets you view or update the final data tables. Each object in the upper part of the data canvas is called a node, and it represents a data source, an operation where data from two sources have been combined, a data function, or similar. In the source structure, you can click on different nodes to see what data or modifications are added in that step. This helps you get an insight in how the final data table, used in the analysis, was created. You can also use the data canvas to change settings for different nodes or operations, or to replace or reload data from different sources.
On the
authoring bar, click
Data canvas
![]() .
.
The data canvas contains pretty much the same functionality as the
Data Table Properties dialog (installed client
only), but with more context. Click
![]() Settings or the
Click for more options
Settings or the
Click for more options
 menu to find functionality
not directly visible on the page.
menu to find functionality
not directly visible on the page.
 on the node of interest
instead.
on the node of interest
instead.
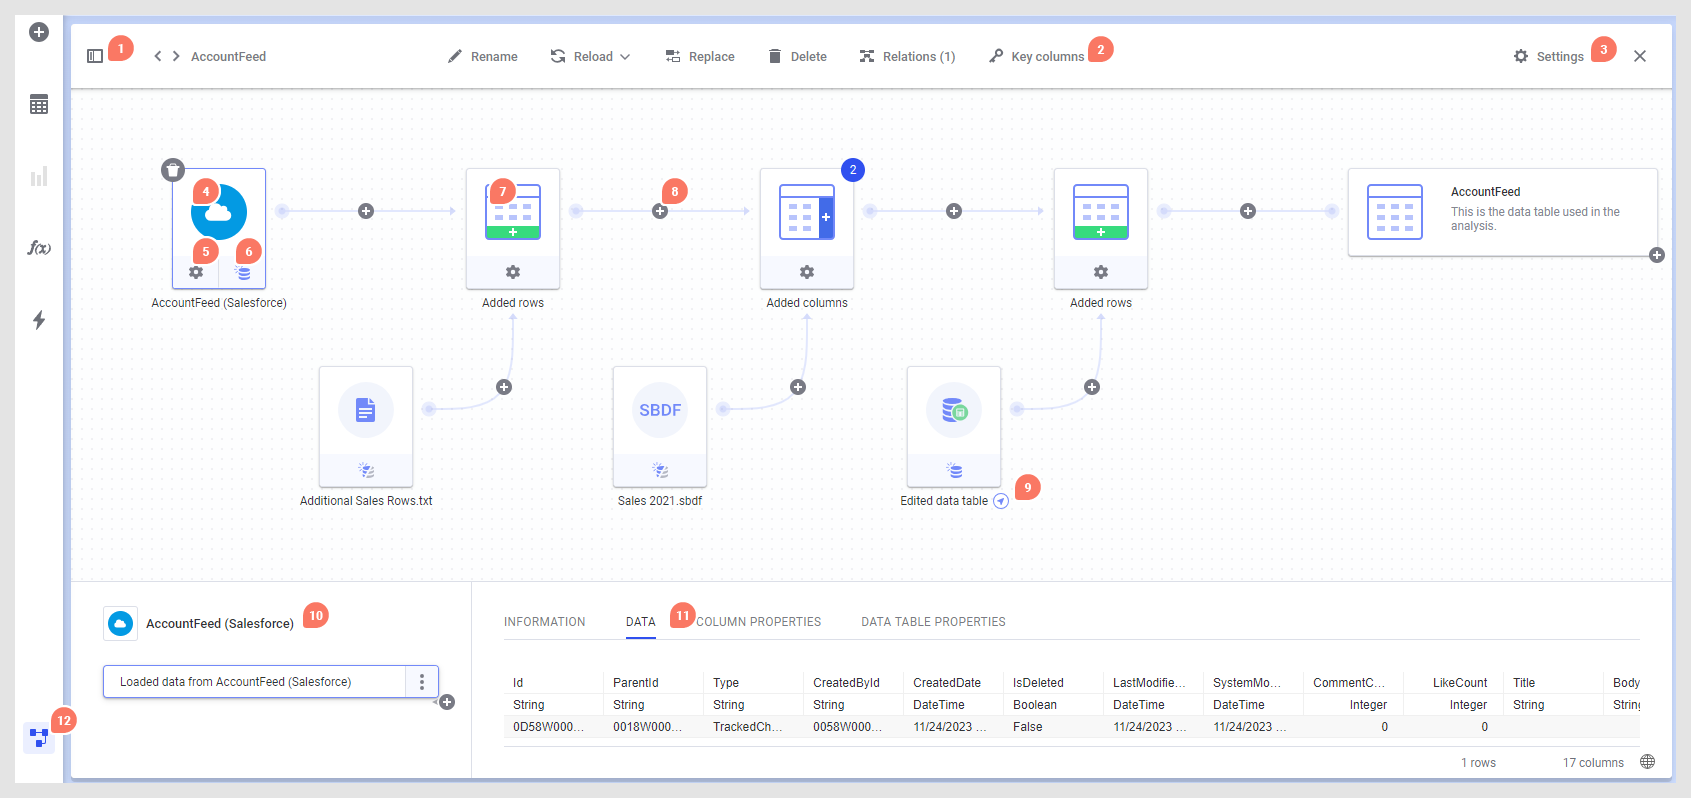
- Switch which data table or data function to inspect using the data canvas sidebar, or use the arrows to step through the list of all data tables or all data functions, depending on what is selected. You can use search in the sidebar if your analysis contains many different items. The top Data tables header in the sidebar can be selected to show an overview of all data tables in the analysis, and their properties. See Data tables overview for more information.
- The toolbar at the top of the data canvas contains tools that work on the entire data table, such as Rename, Reload, Replace, Delete, Relations and Key columns.
- Click Settings on the data table toolbar to get access to more options that affect the whole data table. For example, here you reach the option to top-level embed the final data table, change how to handle Filters for the data table, and you have the option to hide data tables (for example, if they are used for intermediate calculations) from axis selectors by clearing the Show data table in user interface check box. You can also choose to Cache calculated columns or (in the installed client) clear the Show prompt for column mismatches check box. Hover over each setting in the popover for more information.
- In the graphical view of the data canvas, click on a node to view more information about that node in the fields below.
- If the settings for the node can be changed, click the settings icon under the node to edit it. See Editing a data connection, Editing column matching or other settings for added rows and Editing settings for added columns for more information. Note that settings buttons that you have had access to in a previous session might be missing if data from another node in the data table is unavailable, so make sure that you get all of the expected data into the analysis.
- For some types of sources,
you can change the
Data loading settings by clicking on the button
at the bottom of a node, and switching to a different
setting:
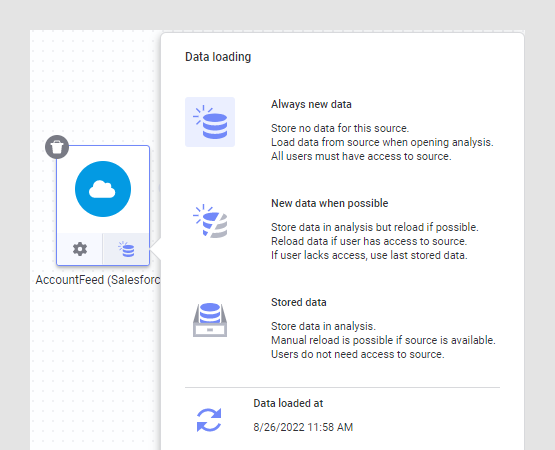 Here, you can also reload linked data, for data sources where this is possible, as described in Reloading data.Note: Some nodes do not have access to the original source. In that case, the only option available will be Stored data. For example, this is the case when you have uploaded a file from your local computer to the Spotfire web client, or if you have added data from the clipboard using the installed client. See Linked, stored, and embedded data for more information about data loading settings.
 - When more data has been added to the original data table, the data to add is shown as a separate node and the original data plus the added rows or columns is shown in the Added rows or Added columns node.
- You can add more rows or columns to a certain point in the data structure by clicking the plus sign between two nodes. When using the installed client, you can also add transformations between nodes. Transformations added using the plus sign will end up as the last step on the node to the left of the plus sign. To add a transformation between existing step groups (installed client only), see 10.
- Navigation arrows can be shown if a data table is a linked copy of another data table, or if the data comes from a data function. Click the arrow to navigate to the linked item in the data canvas.
- The field at the bottom left shows the list of step groups on the currently selected node, and, when applicable, provides an entry point for replacing a data source or for removing previously added operations. Using the installed client, you can also add or edit transformations or edit on-demand settings here. If you want to add more rows or columns to a certain point in the structure, you can click the plus sign of interest and select the desired operation. Note that if you insert rows or columns between transformation groups in the list of step groups, any transformations below the insertion point will be moved to the new node in the data structure. If there is an issue with an operation, you will be informed about this using icons and tooltips.
- The field to the right shows details about the selected node or operation. For in-memory sources, click the Data header to see a preview of the data the way it looks after the steps in the selected step group have been applied. You can also see the number of rows and columns in the data at this stage, which makes it possible to investigate whether data has been added in the expected way. The Column properties and Data table properties headers shows the value for each column or data table property, respectively, as specified for the selected node or operation. You can edit column or data table property values on the final node of the data table, as specified in Editing data table or column property values.
- Switch between the data
canvas and the visualization canvas by clicking the
Data canvas icon
 on the authoring bar.
The node to the far right represents the final data table, the way it is used in visualizations in Spotfire. The plus on the final data table lets you add things like calculated columns or hierarchies, and in the installed client also binned columns.
If data functions have been added, you can view information about their current configuration and edit their inputs and outputs from the Data canvas. Click the navigation arrow to jump between the data table source view or the data function view in the data canvas. For more information about data functions, see Data functions in the Data canvas.