Table
On the Table page, you can manage the default settings for new table visualizations.
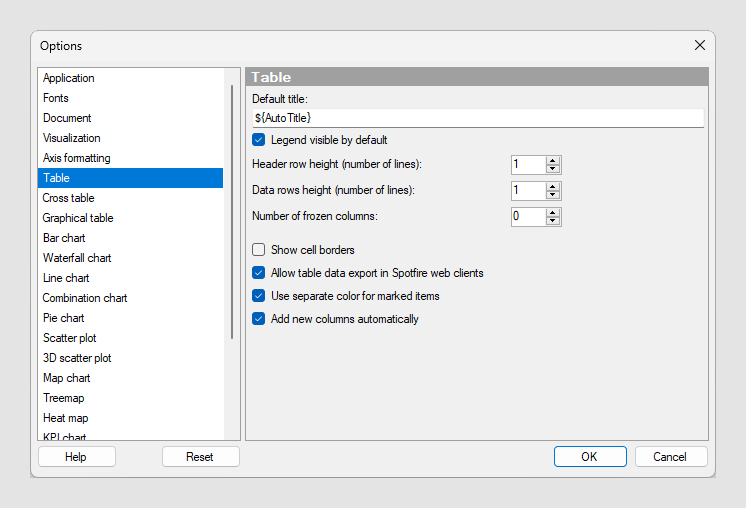
| Option | Description |
|---|---|
| Default title | Specifies the default title for this
visualization type.
Tip: If you edit the title for a table and you want
to use that title expression in all new tables, then you can click on
Set as Default in the
Edit Title dialog directly.
|
| Legend visible by default | Specifies whether the legend should be open when creating a new table. |
| Header row height | Specifies the height of the header row in number of lines. |
| Data rows height | Specifies the height of all data rows in number of lines. |
| Number of frozen columns | Specifies the number of columns on the left-hand side to be frozen, that is, they will not scroll out of sight when the scroll bar is moved to the right. |
| Show cell borders | Specifies whether cell borders should be visible in the table. |
| Allow table data export in Spotfire web clients | Specifies whether a Spotfire web client user is allowed to export the data from the table. |
| Use separate color for marked items | Select this check box to use a specified marking color (default is green) for marked items in this visualization type. If the check box is cleared, then unmarked items will be faded out instead. |
| Add new columns automatically | Select the check box to change the default setting so that any new columns in a data table are also automatically added to table visualizations using that data table. |
| Reset | Resets all properties on this page to the default values. Note that an administrator can configure which settings should be default for certain user groups on the server. If you are a member of such a group, the options on this page will be set to these defaults when you press the Reset button. |