Visualization
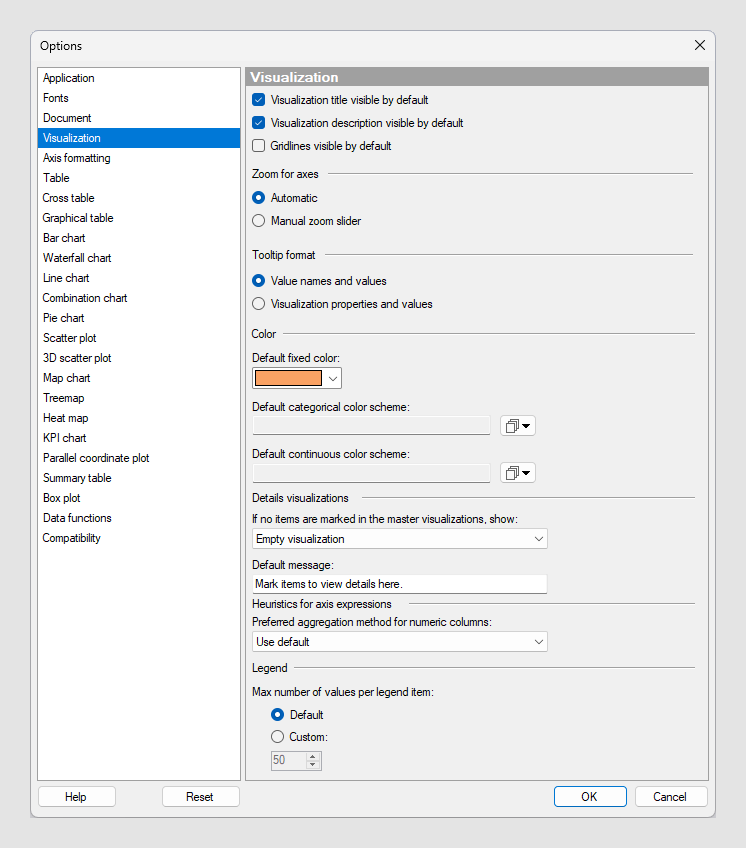
On the Visualization page, you can manage default settings affecting all visualization types. These settings take effect when creating a new visualization.
| Option | Description |
|---|---|
| Visualization title visible by default | Select whether the title bar for new visualizations should be visible by default. |
| Visualization description visible by default | Select whether the description for new visualizations should be visible by default. |
| Gridlines visible by default | Select whether gridlines should be visible in new visualizations (where applicable) by default. |
| Zoom for axes | Select whether zooming should be automatic or require the use of manual zoom sliders, when creating a new visualization. |
| Tooltip format | Select whether the tooltip should show
"Value names and values" or "Visualization properties and values". Generally
speaking, the first option means that the tooltip will show the column names
and corresponding values for the highlighted row. The second option means that
the tooltip will show the name of the properties (rather than the corresponding
columns) and the values.
Example "Value names and values": Product: Bananas Month: March Sales: 3300 Example "Visualization properties and values": Color: Bananas X: March Y: 3300 |
| Default fixed color | Select which color should be used as the fixed color in all visualizations. |
| Default categorical color scheme | Select which scheme should be the default
categorical color scheme for all visualizations. If the color scheme is
categorical, only the colors from the color scheme will be used in the
visualizations. No values will be matched between the color scheme and the
visualizations. And if the selected color scheme contains any rules, they will
not be included.
Note: Changing the default color scheme will not affect any
already existing visualizations. The new default scheme will only be used in
visualizations created after the change.
|
| Default continuous color scheme | Select which scheme should be the default
continuous color scheme for all visualizations. If the color scheme is
categorical, only the colors from the color scheme will be used in the
visualizations. No values will be matched between the color scheme and the
visualizations. And if the selected color scheme contains any rules, they will
not be included.
Note: Changing the default color scheme will not affect any
already existing visualizations. The new default scheme will only be used in
visualizations created after the change.
|
| Details visualizations | Settings for specifying the default behavior when using details visualizations where the marking in one or more main visualizations decides what will be shown. See Drilling down into details to learn more about using details visualizations to drill down into your data. |
| If no items are marked in the master visualizations, show | Select what details visualizations should
show when
no items have been marked in their main
visualizations.
Because different visualization types have different available attributes, it varies between visualization types exactly what will be shown using the available alternatives. For example, some visualizations do not show any axis selectors, and others do not show scales.
|
| Heuristics for axis expressions | Under
Preferred aggregation method for numeric
columns you can select a default aggregation method to use for all
numeric columns.
If Use default is specified, Spotfire tries to select a suitable aggregation method for each column, based on built-in heuristics. Sum is the most commonly used default aggregation method. If you prefer a particular aggregation method to be used, select it in the menu. When specifying a preferred aggregation method, the built-in heuristics are no longer used. |
| Legend | Under
Max number of values per legend item you
can specify how many values to show at most per legend item for new
visualizations. Use the
Default option to show the default of
max 50 values. If an administrator defines a max number, this number is used as
the default.
An administrator can define this max number using the Administration Manager preference MaxValuesPerLegendItem. Use the
Custom option to define a specific
number. The number you specify here must be between 1 and 250.
Note: You can also specify a max number of values in the
visualization properties for individual instances of a visualization. What you
specify there takes effect immediately.
|
| Reset | Resets all properties on this page to the default values. Note that an administrator can configure which settings should be default for certain user groups on the server. If you are a member of such a group, the options on this page will be set to these defaults when you press the Reset button. |