What is a Cube?
An OLAP (Online Analytical Processing) cube is a multi-dimensional representation of data.
The OLAP cube consists of a set of measures (or facts) and a number of dimensions.
Dimensions organize the data for a user in relation to an area of interest, such as customers, stores, or geographies. Dimensions are usually hierarchical in nature. Measures (facts) reside in the intersections between the dimensions. As such, the measures or facts are aggregated by the cube itself (either beforehand, or, they are dynamically calculated).
This differs from relational databases where the measures or facts are stored in the database table and you apply aggregation methods when the database table is queried.
Cube Example
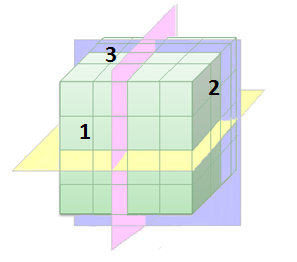
In the schematic image above, the sides of the cube could be said to represent different dimensions and the cell contains the associated measure.
As a simplification, if side 1 represents product type, side 2 is a time unit, and side 3 is region, then the cube could be queried in several different ways: the yellow plane could mean "Show sales per product for different years.", the pink plane could mean "Show sales per product in different regions." and the blue plane "Show sales per region for different years.".
In Spotfire, an OLAP cube is represented as a table. If you are new to Spotfire, a good starting visualization to use is the cross table visualization (also known as a spreadsheet).