 .
.If you are working with in-memory data, you can add columns to your current data table to create a join between data from different sources, and merge it to a single data table in Spotfire. Data can be added from a local file, a data file previously saved in the library, from imported data connections, from information links, from data functions that produce data, or, from the clipboard.
Even though data from different data tables often can be viewed in the same visualization, it might be preferred to actually incorporate similar data into a single data table. When multiple data tables are used in one visualization, the join of the two tables is done after aggregation has been performed. Therefore, if you want to perform joining of tables before any aggregations, or, if you want to create certain calculated columns based on data from two sources, you might want to insert data from one table to the other.
You add data from the Files and data
flyout .
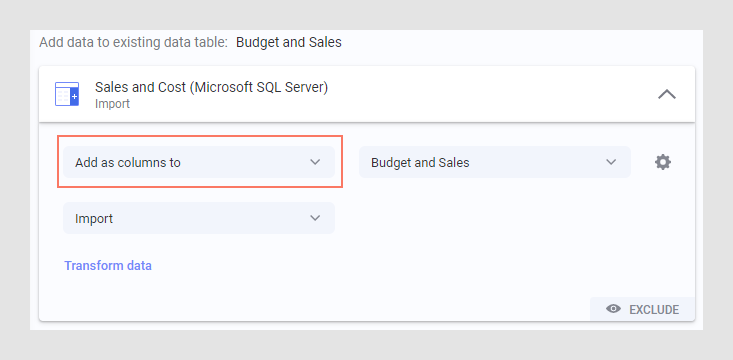
When you add data into your analysis, you can select to add the data as new columns in another data table from the final step in the add data workflow (the summary view):
You can also insert columns into a specific place in a data table structure, as described below.
To add columns into a specific place in the data table structure:
On the authoring bar, click
Data canvas ![]() .
.
Make sure the data table of interest is selected in the upper-left part of the Data canvas.
Comment: This step is only applicable if you have two or more data tables in the analysis.
In the data table structure, click the plus sign between the nodes where you want to insert columns, and select Add columns.

Tip: You can also add columns between previously added transformation groups for a selected node.
Select data to add columns from.
In the flyout, click Settings for added columns.
In the Add columns – match columns dialog, verify that the column match suggested by the recommendation engine is the way you want it, or configure the matching as desired. You can add or remove matches, or edit an existing match. To edit a match, click on the row with the match and select one column From original data and one From new data. Click on the x on a row to remove a match. Repeat if necessary.
Comment: When adding columns, matching is done to enable joining between two data sets. Typically, only one or a few columns containing row identifiers should be used in the match.
Tip: If you cannot match your desired columns directly, a transformation added on the node of the original data set might be used to create a calculated column to use in the match.
To the right in the dialog, you see a preview of the data, using the current settings. You can change the Number of input rows to include more rows (from both input tables) in the sample calculation. This can sometimes increase the accuracy of the shown result. However, using too many rows can decrease the performance of the preview.
Optionally, if you do not wish to add all available columns from the added data, as is the default, you can select to skip columns under Columns from new data by clearing the check box for the undesired columns.
Comment: Note that if the data source from which columns were added can be reloaded, and new columns become available after a reload, then the new columns will automatically become included. If this is not desired, you might want to exclude new columns after reloading data by editing the settings for added columns.
Review the Join settings. Look at the interactive Join example, at the bottom of the Join settings field, for information about how rows will be matched using the different join types. You can specify whether or not to match on empty values using the Treat empty values as equal check box.
Comment: Note that selecting an inner join can result in that no data remains in Spotfire, if no matching rows are found. You can edit the join settings at a later stage from the data canvas.
When you are done, click OK.
Optionally, click Transform data to apply transformations on the new source data.
Comment: See Transforming Data to learn more.
Click OK.
Response: The selected columns are added to your data table.
See also:
How to Edit Column Matching or Other Settings for Added Columns