In the summary view, you will
see one box per new source, and, depending on whether the new sources
will be added as new data tables or combined with other data, there
will be a header for each new or updated data table. If the source
is a data function, you might also have access to other
options.
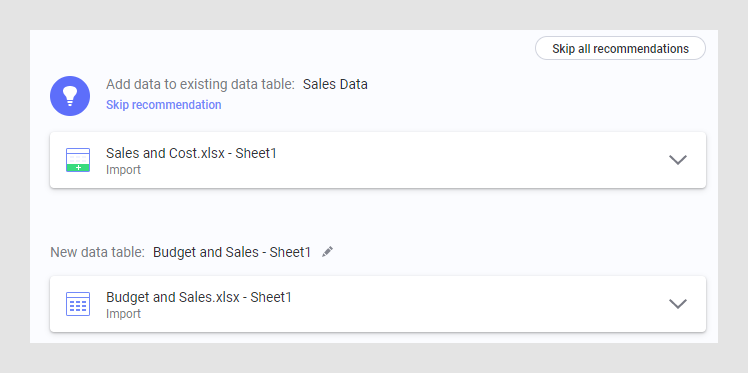
In this example, data was added from a data connection (configured
to be imported), containing two views. Because these two sources were
not that similar to each other, the first suggestion is to add them
as two separate data tables.
Click on the box for a source to expand the box and see the available settings.
For data from data connections, you have the option to change the load method for the added source data. Click the drop-down list showing Import or External to change the setting.
Comment: Data connections (non-cube) usually let you select between Import, External and On-demand. Information links cannot be external but they can be loaded on demand. File data is always imported.
If you have more than one
data source in your analysis and the data is imported, you can select
to add new data either as a new data table or as rows or columns appended
to other data. Change how to add the selected data using the drop-down
lists. If the source is a data function, you might also have
access to other
options.
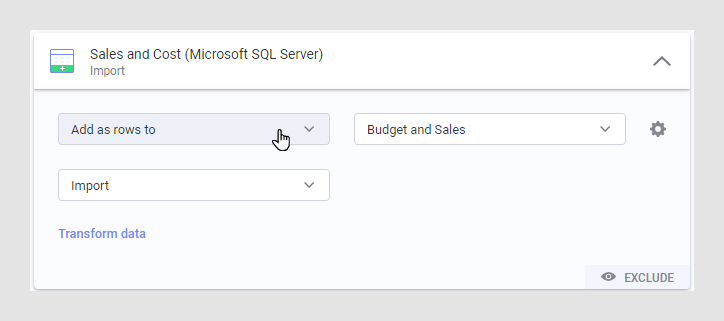
If you choose to add the new data as rows or columns, you must also
select to which other data to append your data. Other choices might
require more selections.
If applicable, you can review
or edit the settings for added rows or columns by clicking the settings
button  .
.
Comment: See How to Edit Column Matching or Other Settings for Added Rows and How to Edit Column Matching or Other Settings for Added Columns for details about what you can change.
You might also have the option to Transform data.
Comment: Transformations cannot be applied to external (in-db) data connections, but you can often select to import the data from a connection and then transform the data, if the data needs modification.
If the chosen data gives you more than one source or value to handle, you can ignore those you are not interested in by clicking Exclude. For example, a predefined data connection might contain more views than you are currently interested in, or, a data function might produce multiple output values, and you only want to add one of them as a document property value in your analysis.
Comment: Click the box again to include the source, if you excluded it by mistake. You can add a previously excluded data connection view at a later stage by adding the view using the Data connections in current analysis option in the Files and data flyout, or by editing the data connection from the data canvas.
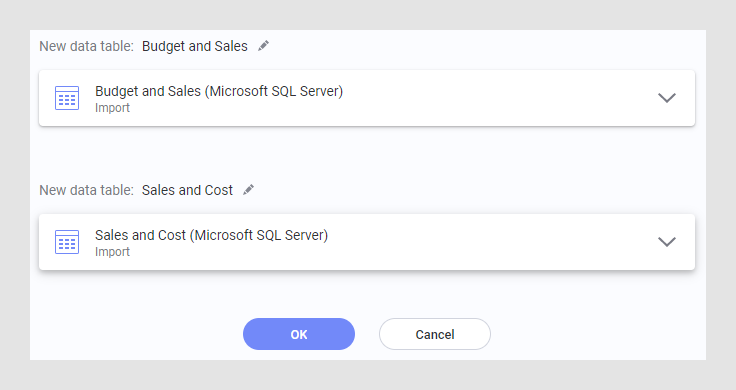
If desired, you can change the name of a new data table by clicking the icon with a pencil next to the data table name and typing a new name.
When you are satisfied, click OK.
Comment: You can edit settings for your data source, or for added rows or columns, in the data canvas at a later stage. However, to change the load method from external to imported or vice versa, you must replace the entire data table. Data function settings can be edited from Data Function Properties.