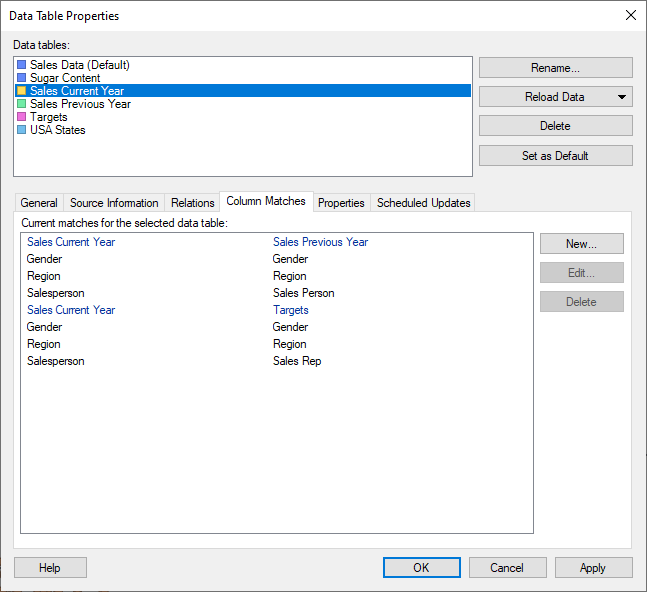
This tab gives you an overview of column matches between different data tables, hinting about which data tables may be suitable to view in a single visualization.
To reach the Data Table Properties dialog:
On the menu bar, select Data > Data table properties.
Click on the Column Matches tab.
Option |
Description |
Data
tables |
Lists the data tables available within the document. The names of the data tables in this list are the names that will be shown in the data table selectors, in the legends of visualizations, etc. You cannot have two data tables with identical names in the same analysis. |
Rename |
Allows you to change the display name of the selected data table. Tip: You can also change the data table name in the Data Canvas. |
Reload
Data |
Reloads the data for the selected data tables from the sources, if sources are available. This is a way to refresh the data for one or more data tables while analyzing, without having to reload the entire file. See Embedded or Linked Data? for more details about reloading. You can select to either reload Linked data only, which reloads all linked data sources with the data loading settings Always new data or New data when possible, or All data which reloads all sources that are possible to reload, including Stored data and Embedded data (when applicable). Note: If a data table is loaded on demand or calculated using a data function you need to click OK in the Data Table Properties dialog to actually start the data reload. |
Delete |
Removes the selected data tables from the analysis. Any visualizations that use a deleted data table will become invalid. You cannot delete all data tables; see Replacing a Data Table or Replacing a Data Source instead. |
Set
as Default |
Sets the selected data table to be the default data table. The default data table is used when new visualizations are created, unless you have just interacted with the Data in analysis flyout, in which case the data table selected in the Data in analysis flyout is used. You can always change the data table to use in a specific visualization from the Data page in Visualization Properties or from the Data table selector in the legend. |
Current
matches for the selected data table |
Lists all matches that are defined for the selected data table.
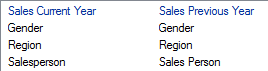
In this case three column matches exist between the selected data table 'Sales Current Year' and the data table 'Sales Previous Year':
Columns with the same name are automatically matched if they are of the same data type. This means that the match between 'Salesperson' and 'Sales Person' has been added manually. |
New |
Opens the New Match dialog where you can manually specify a match between two columns from different data tables. |
Edit |
Opens the Edit Match dialog, where you can modify an existing match. |
Delete |
Deletes the selected match. |
See also:
How to Edit Data Table Properties
Data Table Properties - General
Data Table Properties - Source Information
Data Table Properties - Relations
Data Table Properties - Properties
Data Table Properties – Scheduled Updates