To reach the Data Table Properties dialog:
On the menu bar, select Data > Data table properties.
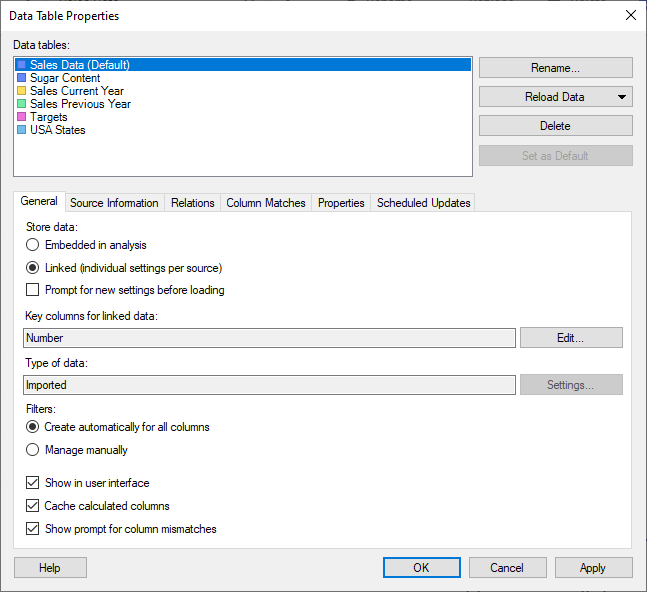
Click on the General tab.
Option |
Description |
Data
tables |
Lists the data tables available within the document. The names of the data tables in this list are the names that will be shown in the data table selectors, in the legends of visualizations, etc. You cannot have two data tables with identical names in the same analysis. |
Rename |
Allows you to change the display name of the selected data table. Tip: You can also change the data table name in the Data Canvas. |
Reload
Data |
Reloads the data for the selected data tables from the sources, if sources are available. This is a way to refresh the data for one or more data tables while analyzing, without having to reload the entire file. See Embedded or Linked Data? for more details about reloading. You can select to either reload Linked data only, which reloads all linked data sources with the data loading settings Always new data or New data when possible, or All data which reloads all sources that are possible to reload, including Stored data and Embedded data (when applicable). Note: If a data table is loaded on demand or calculated using a data function you need to click OK in the Data Table Properties dialog to actually start the data reload. |
Delete |
Removes the selected data tables from the analysis. Any visualizations that use a deleted data table will become invalid. You cannot delete all data tables; see Replacing a Data Table or Replacing a Data Source instead. |
Set
as Default |
Sets the selected data table to be the default data table. The default data table is used when new visualizations are created if no specific data table is selected in the Data in analysis flyout. You can always change the data table to use in a specific visualization from the Data page in Visualization Properties or from the Data table selector in the legend. |
Store
data |
Defines how you want data from the selected data table to be stored when saving the analysis. |
Embedded
in analysis |
Use this option to embed the data from the selected data table in the analysis. By embedding all data in the analysis file it will be self-contained with data, but nothing is saved below the top level of the data table. This allows you to share the analysis with others who do not have access to the same databases you do, or who need to use their laptops offline. Note: If you embed the final data table you lose the ability to configure different data loading for different parts of the data table. Linked data, on the other hand, can contain one or more stored parts and is often the preferred alternative. |
Linked
(individual settings per source |
Use this option to be able to link parts of the selected data table to the original data sources. This is useful when data is updated or changed from time to time. For example, if you create an analysis file that gets its data from a database that is updated each night, then the linked option allows you to open the analysis file and have it automatically show the latest numbers. It will still use the visualizations and settings you already set up, but base them on the updated data. Also, data might take up lots of space so you might not want to embed a copy of a large data table if you can access it from another source. With linked data, you have the option to use different data loading settings for different parts of the data table. See Embedded or Linked Data? for more information. Note: Make sure that all people who are going to use the analysis also have permissions to access the linked data, or use the data loading setting "New data when possible", so stored data is available for users who do not have access to the source. |
Prompt
for new settings before loading |
Select this check box if you want to see the import settings or any available prompt steps for the selected data table when you open the analysis. If the check box is cleared, the last used settings will be applied. |
Key
columns for linked data |
If specified, lists the columns that have been specified to define an identifier for all rows in the selected data table. Key columns are used to identify rows when markings, tags or bookmarks are saved with a linked data source. However, there is no guarantee that a selection always can be reapplied even if key columns are specified since a selection of a visualization item might include references to other columns than the key columns. |
Edit |
Opens the Select Key Columns dialog where you can specify the columns to use to create a unique identifier for all rows in the selected data table. |
Type
of data |
Displays the type of data source. |
Settings |
If applicable, opens a dialog where the data source settings can be modified. If the data table is the result of a calculation (for example, a data relationships calculation), then the dialog for calculating the data table is opened again. For information links or data connections that are loaded on demand, the on-demand settings can be changed. |
Filters |
[Not applicable for in-database data tables which are always managed manually with regards to filtering.] |
Create
automatically for all columns |
Use this option for an automatic addition of one filter for each column in the (internal) data table. |
Manage
manually |
Use this option to disable the automatic creation of filters and allow manual creation or deletion of filters. Note that selecting this option will turn off the Marked rows > Filter to and Marked rows > Filter out functionality. |
Show
in user interface |
Select this check box to show the data table in the axis selectors of visualizations, and in the Data in analysis flyout. Clear the check box to hide reference tables that should not be used in the analysis. For example, if you create intermediate tables that are used to produce other data tables, you may want to hide those "temporary" data tables from all views. |
Cache
calculated columns |
If your data is embedded in the analysis, or, if it is linked and configured with the Data loading setting Stored data, select this check box if you want calculated columns in the selected data table to be cached in the analysis file. This option may be useful if your analysis contains time-consuming calculations and the underlying data is only updated occasionally. Calculated columns where the original data has changed will be recalculated when opening the analysis, but if no changes are done, the cached results are used in the analysis. Clear the check box to always recalculate the calculated columns. This option can be used to reduce the file size of the analysis file. Note: For linked data with the Data loading setting Always new data or New data when possible, calculated columns cannot be cached. For such data, selecting this check box will have no effect. See Embedded or Linked Data? for more information on data loading settings. |
Show
prompt for column mismatches |
If selected, the Replace Column – Match Columns dialog is shown if there are inconsistences in the data matching when data in the data table is replaced. That dialog makes it possible to make manual matches between columns in the old and new data. Clear the check box to only get automatic matches, and to skip all manual questions. See also Options – Document. Note that this check box will not be available for data tables where the functionality is not applicable; for instance, for implicitly added geocoding tables. |
See also:
How to Edit Data Table Properties
Data Table Properties - Source Information
Data Table Properties - Relations
Data Table Properties – Column Matches
Data Table Properties - Properties