Working with Multiple Data Tables
When you configure an analysis in Spotfire, you may want
to be able to visualize data from more than one data table. Adding other
data tables is fairly easy; just click Files and
data  on the authoring bar, and select the
data source of interest. See Choosing
the Data to Analyze and Choosing
How to Load the Data for more information. However, if you choose
to bring in a lot of data tables, you may find it difficult to keep track
of which data tables are related and which are not. Spotfire will add
some extra visual hints when more than one data table is available to
help you see which data tables are related. You may also want to view
which data tables have matching columns and therefore can be combined
in one visualization. Or simply view which data tables have already been
combined in a certain visualization.
on the authoring bar, and select the
data source of interest. See Choosing
the Data to Analyze and Choosing
How to Load the Data for more information. However, if you choose
to bring in a lot of data tables, you may find it difficult to keep track
of which data tables are related and which are not. Spotfire will add
some extra visual hints when more than one data table is available to
help you see which data tables are related. You may also want to view
which data tables have matching columns and therefore can be combined
in one visualization. Or simply view which data tables have already been
combined in a certain visualization.
You can always get a collected view of all data tables
in the analysis by selecting Data > Data table
properties on the menu bar, or by clicking Data
canvas  on the authoring bar.
.
To
see which data table is the main data table in a certain visualization:
A visualization can combine data from many data tables,
but one data table is always the main
data table, and works as the anchor point in the data for the visualization.
See Multiple
Data Tables in One Visualization to learn more about using many data
tables in one visualization.
Look for the data table selector
in the legend of the visualization.
Comment: When a new data table is added, visualizations
that you create will normally show the legend with the data table
selector visible. However, any old visualizations created before the
second data table was added will not display their data table selectors
automatically.
If you cannot see the data
table selector in the legend, right-click in a white area of the legend
and select Data table.
Alternatively, in the Visualization
Properties dialog you can go to the Data
page and directly see which data table is being used, or, you can
go to the Legend page and display the
legend and the data table selector by selecting the appropriate check
boxes.
Comment: You can switch to a different main data
table from the menu on the data table selector.
To
view information about the active data table:
The status bar, which is located at the bottom or the top
of the window displays information about the main
data table used by the active visualization (the visualization that
was last clicked upon). If the information is not visible, click  .
.
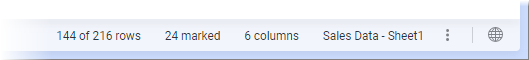
The information displayed is:
the current number of filtered
rows and the total number of rows in the main data table (but if the
data table is loaded on demand, then the number of currently loaded
rows is shown).
the number of marked rows,
the number of available columns,
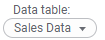
the name of the main data
table in the active visualization.
Note that in-database data tables (external data) do not
have access to the detailed information about rows and columns because
the data shown in a visualization is aggregated by the external data source
and not within Spotfire.
To differentiate two data tables in the filters
panel:
The filters from one data table are always grouped within
a single data table group, which can be expanded or collapsed in the filters
panel. Filters cannot be moved from one data table group to another. Note
that no data table group headers will be shown for in-database data tables
until filters have been created.
To change the way filtering in a related data table
affects a data table:
Go
to the filters panel and locate the data table header for the data
table of interest.
Comment:
Note that you need to specify how each data table should respond to
filtering in all other related tables separately, to be certain of
what will be shown in the visualizations after filtering.
Click
Filtering in related data tables  .
.
Response:
A drop-down menu is shown, where all related data tables are available.
Select
the data table for which you want to change how the filtering
should affect the current data table, and select one of the following
options: Include Filtered Rows Only, Exclude Filtered Out Rows or Ignore
Filtering.
Comment: See Filtering
in Related Data Tables for more information about the different
options.
To see which column matches exist in the analysis:
See To
view the current column matches in the analysis.
To see which data tables are used in a visualization:
See To
view the current column matches in a visualization.