Zoom sliders are used to get a closer look at details in your
visualization.
About this task
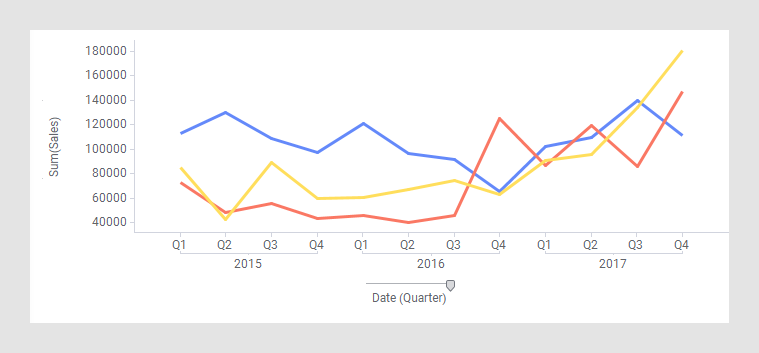
The line charts below illustrate the use of a zoom slider. The line
chart at the top shows sales from Q1 2015 to Q4 2016.
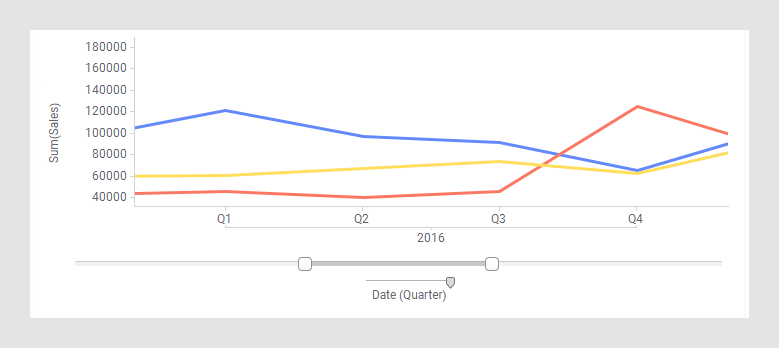
By adding a zoom slider to the line chart, and then adjusting it by
dragging its handles, you can look closer at, for example, the quarters in
2016.
Procedure
-
Right-click the visualization, and select
Properties in the opened menu.
The
Properties pop-over is shown.
-
Click
Axes.
The
Axes section is shown.
-
Beneath the axis you want to supplement with a zoom slider, select
Show zoom slider.
A slider is added to the axis.
-
Zoom in to details by dragging the handles of the zoom slider.
Tip: You
can grab the gray part of the zoom slider and drag the slider to the left or
right to pan horizontally.