Authoring data functions
Data functions are calculations done by another engine than the internal Spotfire data engine. As a script author, you can create data functions that other authors in your organization can reuse in their own analyses, by saving your data function definition to the library. You can help others, and make sharing more efficient, by writing thorough descriptions, and by using well-defined parameter names or display names when you create your data function.
About this task
It is also common that data function authors add the data functions to specific analyses, to help the end users to know how it should be used, and include the actual mapping for a particular data source or field of interest.
Before you start creating your own data functions, read What are data functions? to understand the different concepts. It is particularly important that you know the difference between the data function definition (which includes the script and parameters) and the data function instance (which is the mapping of the inputs and outputs from the definition, when the data function is used in a Spotfire analysis).
Before you begin
A common workflow
This section describes a common workflow when creating data functions.
Procedure
-
Add a data function instance to an analysis by running it from
the f(x) flyout
 , from the
Files and data
, from the
Files and data
 flyout, or (in the
installed client only) via
Insert in the
Data Function Properties dialog.
This step is needed if you want to add action controls to text areas in an analysis. It is also possible to use Run from the Register Data Function dialog, but note that each time you run the data function, you will add a new instance of the data function to the document. You can edit a data function instance within an analysis from the Data canvas, if needed.Note: Normally, you should only keep a single instance of the data function in the analysis and edit the definition for this instance, rather than running the same data function definition multiple times. Make sure you clean up the analysis by deleting unnecessary instances from the data canvas or the Data Function Properties dialog if you happen to add more instances during developing and testing.
flyout, or (in the
installed client only) via
Insert in the
Data Function Properties dialog.
This step is needed if you want to add action controls to text areas in an analysis. It is also possible to use Run from the Register Data Function dialog, but note that each time you run the data function, you will add a new instance of the data function to the document. You can edit a data function instance within an analysis from the Data canvas, if needed.Note: Normally, you should only keep a single instance of the data function in the analysis and edit the definition for this instance, rather than running the same data function definition multiple times. Make sure you clean up the analysis by deleting unnecessary instances from the data canvas or the Data Function Properties dialog if you happen to add more instances during developing and testing.
Script languages
Data functions are often based on R scripts running under Spotfire® Enterprise Runtime for R (a/k/a TERR™), but they can also be based on open-source R, or Python scripts. The available types in the Register Data Function dialog depend on which calculation engines you have access to. See the corresponding service documentation for information on how to configure those engines or contact your Spotfire administrator.
About this task
- To use TERR, either use the local engine provided in your Spotfire installation, or use the Spotfire® Enterprise Runtime for R - Server Edition, the TERR service, installed on a node available to your Spotfire Server.
- To use Python, you can use either a local installation of Python or the Spotfire® Service for Python, installed on a node available to your Spotfire Server. The installed Spotfire client includes a python.exe but you can also switch to use another installation under . Read more about how to work with Python in the document Python Data Functions in Spotfire®.
- To use open-source R,
use the
Spotfire® Service for R, installed on a
node available to your Spotfire Server.
Note: Open-source R is available under separate open source software license terms and is not part of Spotfire. As such, open-source R is not within the scope of your license for Spotfire. Open-source R is not supported, maintained, or warranted in any way by Cloud Software Group, Inc. Download and use of open-source R is solely at your own discretion and subject to the free open source license terms applicable to open-source R.
- To use Statistica, which
is included in the Spotfire Data Science license, either use the local
Statistica engine or the
Spotfire Service for Statistica (also
known as the Statistica Service), installed on a node available to your
Spotfire Server. Statistica data functions are somewhat different from other
data functions in that you can expose workspaces authored in Statistica as data
functions in Spotfire. This is done using the Statistica Integration reached
from
.
Note: You cannot create any Statistica data functions using the Register Data Functions dialog.See the Spotfire Integration with Statistica for more information on how to work with these type of data functions, and see the Statistica Help for general information about Statistica.
See https://spotfi.re/sr for information about the system requirements for the services.
Getting started
You can define an open-source R data function from an existing function in the corresponding Spotfire Service for R, or by writing a script directly in the Register Data Functions dialog, and then running using the appropriate engine (for R functions that would be either the TERR engine or the open-source R engine). Other types of data functions are always based on scripts.
About this task
To ensure a rapid response and a good user experience, avoid sending very large data sets from Spotfire to a statistical engine, or invoking complex, long-running calculations.
Example 1: Creating and running a simple R script data function
A simple conversion of the values in a column from degrees Celsius to degrees Fahrenheit. Although this is easy to accomplish using Add calculated column, this serves as an example simple enough to show input and output parameter handling in more detail.
Procedure
-
Define the input parameter
x as a column with the allowed data types Integer and Real.
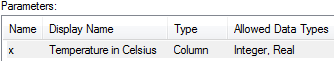
Tip: You can select the parameter on the Script tab, right-click, and use the pop-up menu option Input Parameter to reach the Input Parameter dialog directly.Also remember that any description that you add here can help others making good selections when running or editing the data function later on.
-
Define the output parameter out as a column.

Tip: You can select the parameter on the Script tab, right-click, and use the pop-up menu option Output Parameter to reach the Output Parameter dialog directly.Note that the output display name will not be propagated to the output column name. The column name is always the output specified by the R script. -
Specify that the input parameter x should be a column and select
the data table and column to convert. Note that descriptions you enter for the
data function itself as well as for input and output values show up in the user
interface when running the data function.

Results
Example 2: How to think when creating a data function
If the function to use is a Principal Component Analysis (PCA) calculation, the input would be a number of numerical data columns retrieved from the current data in Spotfire and, optionally, a parameter specifying the percent variation to be preserved by the principal components.
About this task
The output would include three new data tables (scores, loadings and eigenvalue/explained variance table) and a scalar indicating the number of principal components generated.
You can find a number of data functions at the Spotfire Community.