Calculating time periods
You can calculate differences between columns containing points of time to retrieve time periods. The result can be expressed in various units of time.
About this task
Datediff().
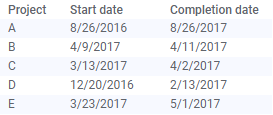
For example, the data table below contains start and completion dates
for some projects, and you might be interested in how many days each project
lasted. Then, you can calculate the length of each time period between the
start date and the completion date.
As a starting point, a scatter plot is created, showing one marker per project.
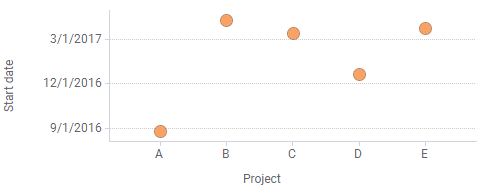
As a starting point, a scatter plot is created, showing one marker per project.
Procedure
-
Click
OK.
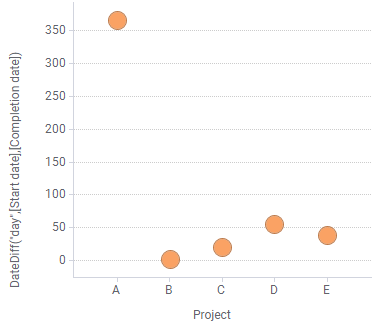
The Y-axis now shows how many days each project lasted, and it is easy to spot the project that took the longest time to complete.
Calculating time periods between time points and today
Sometimes, you are interested in the time period between a certain
time point and today. For example, if a data column contains dates of birth for
individuals, their current ages can be calculated. The
DateTimeNow() function retrieves the current time in
an expression.
In another example, the
If you apply the expression
DateTimeNow() function is used to identify invoices
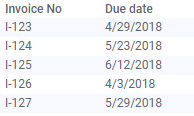
that are urgent to pay, because their due dates are passed. The data used is
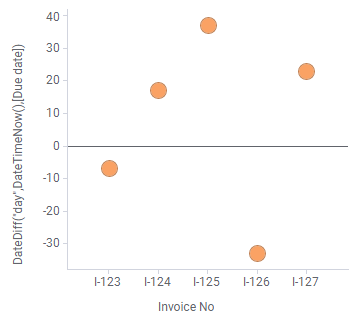
shown below.If you apply the expression
DateDiff("day",DateTimeNow(),[Due date]), negative
differences indicate passed due dates.
The expression was used in the scatter plot below, on the 6th of May
2018, and two invoices, I-123 and I-126, with passed due dates were
found.
Tip: Add a
line at a certain value by clicking the axis and typing a value after
Show a line at in the popover.