Comparison circles algorithm
The drawing of comparison circles is a way to show whether or not the group means for all pairs are significantly different from each other. The Tukey-Kramer method is used for the calculation. Each group (each box plot) gets a circle where the center of the circle is aligned with the group mean value.
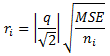
The radius of the circle, ri, is calculated as follows:

where
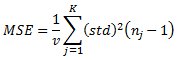
- MSE is the mean standard
error (the pooled sample variance) for each box:

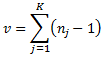
- v is the degrees of
freedom:

- nj is the number of records in the group (count)
- K is the number of groups
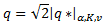
 where q* is the critical
value and q is the upper alpha quantile of the Studentized range distribution
with K groups and v degrees of freedom. The
alpha level (the level at which the difference
between groups would be significant) is specified in the visualization
properties. For details on how the quantile is calculated, see
Aggregations and statistical measures.
The value of q is calculated and updated each time the filtering of the axis is
changed.
where q* is the critical
value and q is the upper alpha quantile of the Studentized range distribution
with K groups and v degrees of freedom. The
alpha level (the level at which the difference
between groups would be significant) is specified in the visualization
properties. For details on how the quantile is calculated, see
Aggregations and statistical measures.
The value of q is calculated and updated each time the filtering of the axis is
changed.
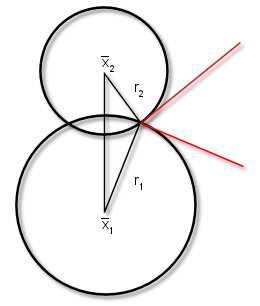
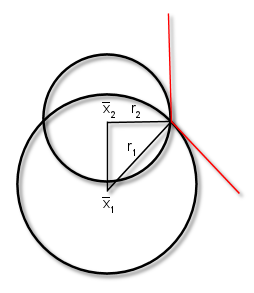
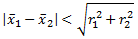
If the circles for different groups do not overlap (or that the external angle of intersection is less than 90 degrees) the means of the two groups are generally significantly different. If the circles have a large overlap, the means are not significantly different.
The explanation to why the overlap defines whether or not group means are significant can be deduced with the Pythagorean Theorem.
| Comparison circles | Mathematical expression | Interpretation |
|---|---|---|
 |

|
The groups are significantly different. |
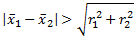
 |
 |
Borderline significantly different. |
 |
 |
The groups are not significantly different. |