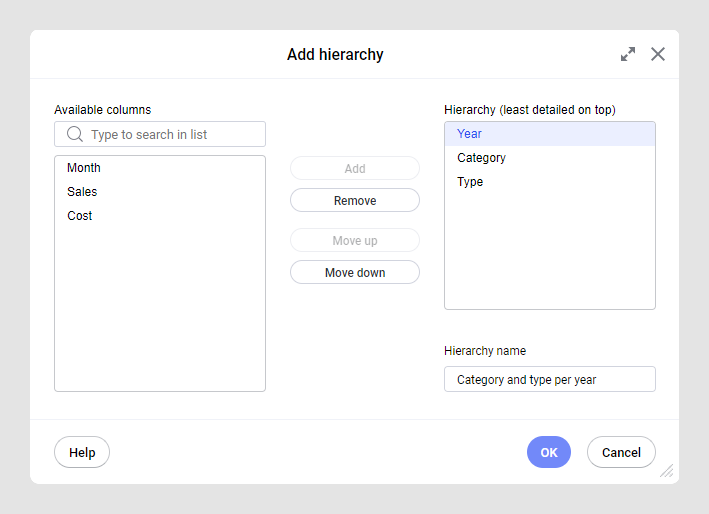
Defining a hierarchy using the Add hierarchy dialog
You can define a hierarchy for use in many visualizations or to obtain a hierarchy filter using the Add hierarchy dialog.
Procedure
-
Select
Data > Add hierarchy on the menu bar to
open the Add hierarchy dialog.
There are more ways to reach the Add hierarchy dialog:
- From the Data canvas: Click the plus sign on the final data table node, and select Add hierarchy.
- From the
Data in analysis flyout: Hover with the
mouse pointer over any column and click the Show filter button
 . Right-click the opened
filter, and select
Add hierarchy.
. Right-click the opened
filter, and select
Add hierarchy.
-
Click
OK.