Showing subtotals in cross table columns
In a cross table, you can display column subtotals, that is partial summarizations.
About this task
To show subtotals within the cross table columns, the vertical axis (or Coulmn axis) must be structured hierarchically with at least two levels.
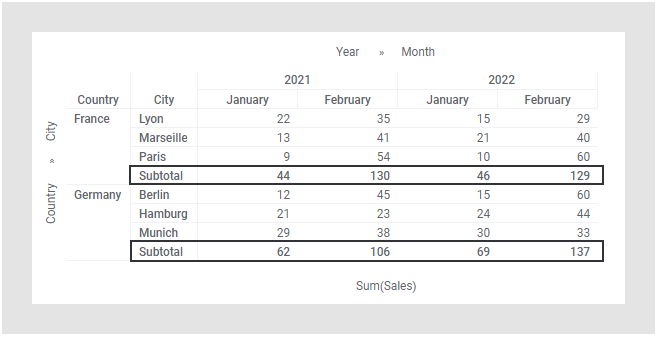
In the hierarchy below, subtotals for the month columns are displayed on the 'Country' level. The aggregation 'Sum' is used to aggregate the 'Sales' values, and accordingly, the subtotals are also calculated using the 'Sum' aggregation.
If the hierarchy on the vertical axis has more than two levels, you can specify on which levels subtotals should be displayed.
Subtotals are calculated using the same aggregation or expression that is used for the calculation of the cell values. The subtotals are not based on the aggregated values shown in the cross table cells; they are by default based on the underlying data table rows. For example, if 'Average' is used as the aggregation method, the subtotal average of a column takes into account all the data rows on which the cell values are based, and not only the averages shown in the cross table cells. See Displaying totals.
Procedure
- Right-click the cross table, and select Properties in the opened menu.
- Click Totals.
- Under Display totals, select the levels in the hierarchy for which subtotals should be shown. (In the hierarchy above, there is only one possible level.)
- Specify where in the cross table column the subtotals should be displayed, Before values or After values .