Intersect()
You use the Intersect() navigation method, when you want to reference the nodes that are the result of the intersection of two or more node navigation methods.
This is exemplified below.
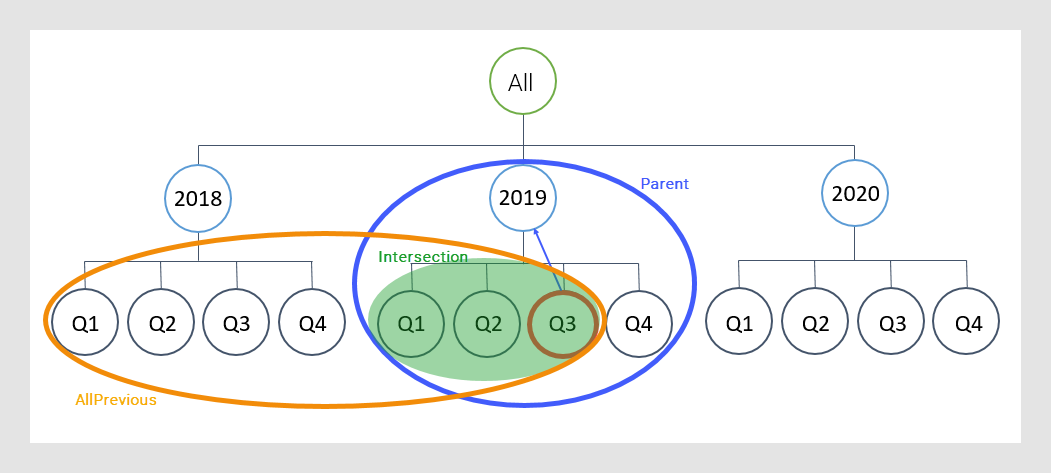
The image illustrates, with Q3 as the current node, the intersection of the AllPrevious() and the Parent() navigation methods. The nodes that are found by both the methods are Q1-Q3, 2019.
No matter which quarter is the current node, the intersection will result in a period that begins with Q1 and ends with the quarter that is the current node. This means that a typical use case for the Intersect() method is a Year to Date calculation (see the example below).
Examples
Example of Year to Date calculation (YTD)
The bar chart shows quarterly sum of sales during 2016-2018.
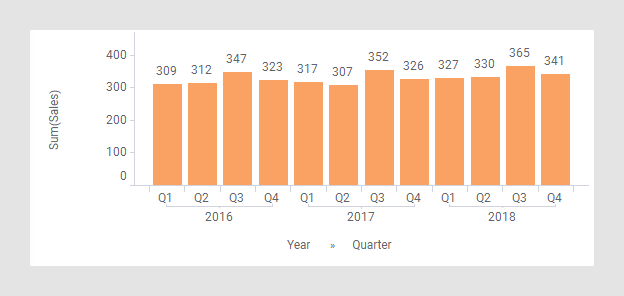
Assume you are interested in the cumulative sums for each of the years. If you use the AllPrevious() navigation method, you will sum all the previous months. But in Q1 2017, you want to start the summing all over again, and disregard the summing of the quarters in the previous year, 2016.
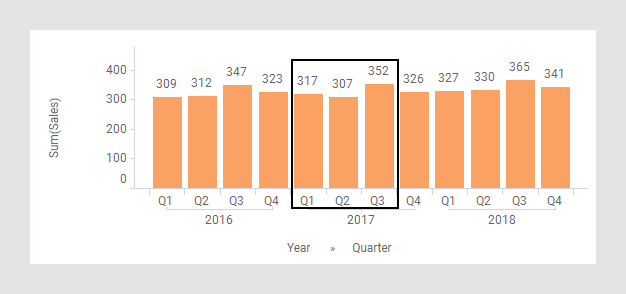
For example, the cumulative sum Q3 2017 should be 976 (317+307+352). To reference only these three bars, the Intersect() method is handy. The AllPrevious() method would include Q1-Q4 2016 and Q1-Q3 2017 in the summing, and the Parent() method would include all four quarters of 2017. The intersection of these two navigation modes, would return exactly the bars in question.
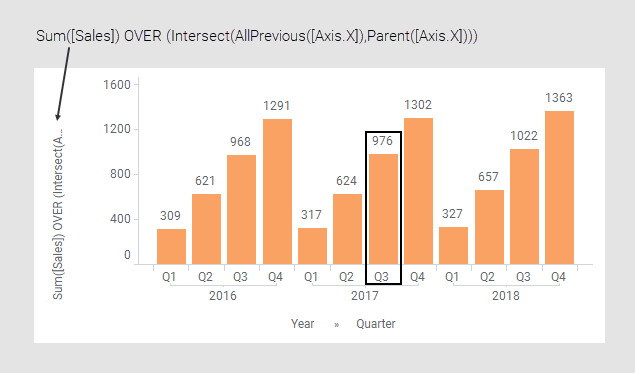
Apply the expression below where Intersect() combines the two methods, and view the result for, for example, Q3 2017:
Example of using Intersect() when data is split by more than one axis
Each time you slice the data using various axes, the data is split into smaller and smaller slices, represented by more and more markers. When you apply an expression, it will work on the smallest slice of data. In the example above, the data is split solely by the category axis. But what happens if you split, for example, also by the color axis? An example will show you.
The bar chart below displays survival statistics from the Titanic catastrophe. The data is split solely by the category axis.
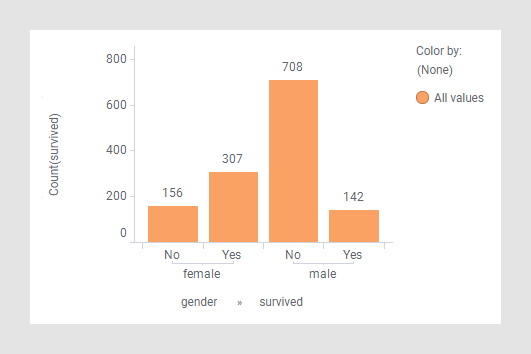
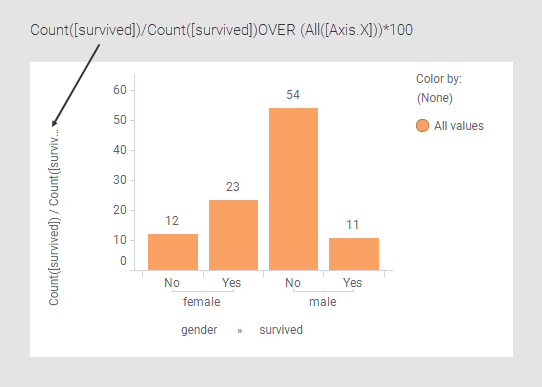
The expression in the next image lets you display this information in percent instead of absolute numbers. See also the All() topic.
Assume you want to distinguish the bars representing those who survived by setting the Color axis to 'survived' as shown below.
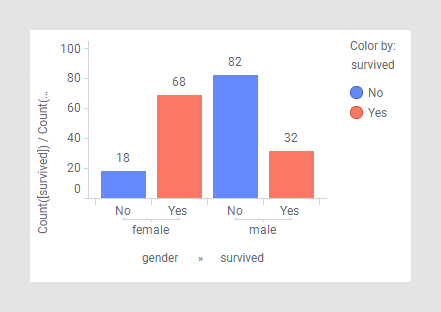
However, note that when doing so, the percentages change! The red and blue bars, respectively, add up to 100% instead of all the four bars. This happens because the expression does not take into account that the data is split into even smaller slices by the color axis. The ...OVER (All([Axis.X]))... part ignores the slicing on the category axis, but not the slicing on the color by axis.
You can, though, keep the colors and add upp all the bars to 100% by using the Intersect() method as shown below.
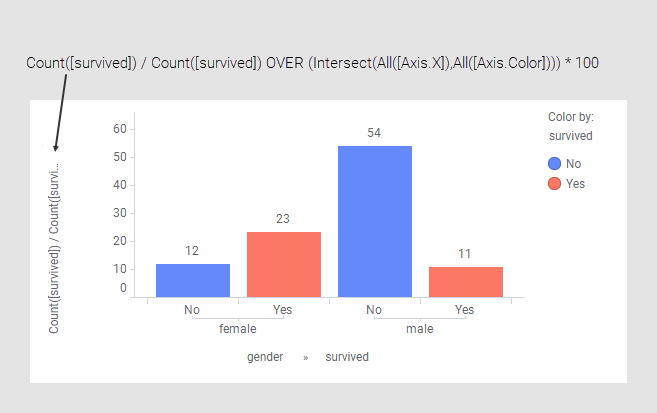
The All([Axis.X]) and the All([Axis.Color]) parts of the expression imply that the slicing on each of these axes should be ignored. The Intersect() method then combines these two parts. Consequently, the value of each bar will be divided by the sum of all the bars.