Know the data
As an analysis author, you can investigate the metadata and learn more about the columns in your analysis. Learn more by inspecting your data in the Data in analysis flyout and in the data canvas.
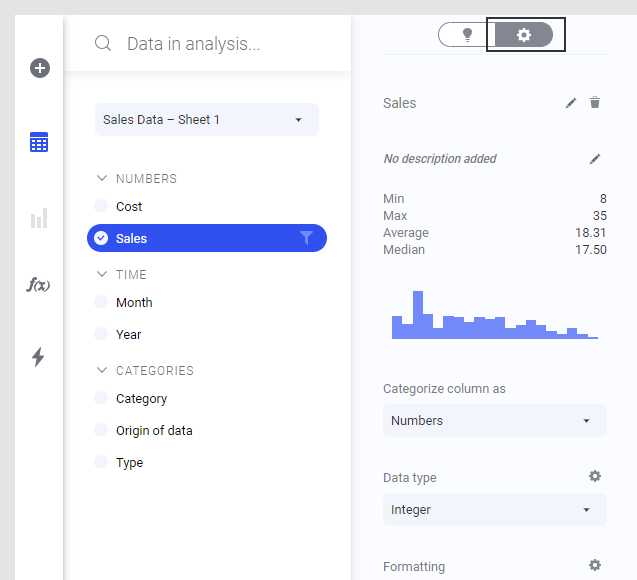
The Data in analysis flyout is automatically opened when you add a new data table. It shows you a structured list of all columns in the data table, where different types of columns are grouped into categories like NUMBERS, TIME, and so on. Numeric data is often used as summarized data on axes in a visualization, whereas categories are used to split the data in different groups. It is possible to change the categorization if the automatic attempt is not good enough. The behavior of a column when added to a visualization differs depending on how it is categorized.
To know the details of a data column, you can select it in the flyout, and click Details on selected column as shown below. Now you can see some metadata, such as the Min, Max or Average value in a numeric column, or the unique count of categories. You also get access to some data preparation and cleansing tools, which can help getting visualizations the way you want them. For more information, see Data in analysis.
You can also get more information about the data in the Data canvas, which is accessed by clicking the button at the bottom of the authoring bar.
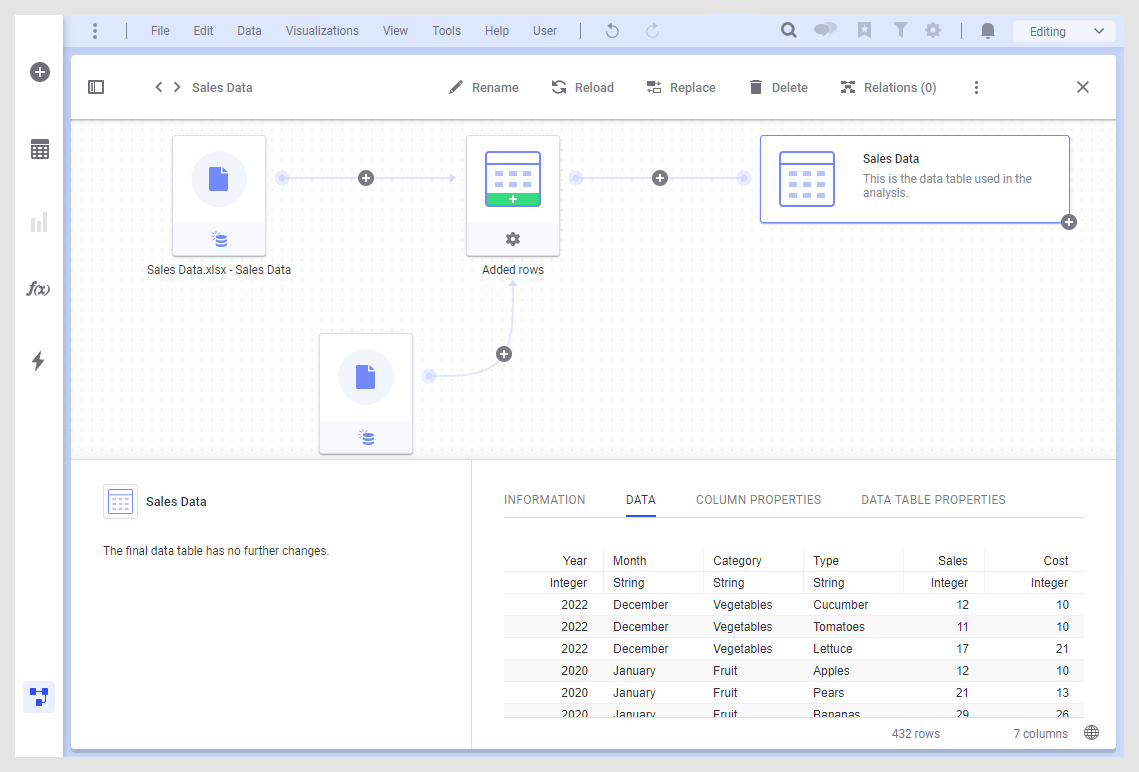
Here you can see how each data table in the analysis was created, and you can add data or edit settings for different data sources. Click each node for details about that source or operation. For more information, see Data canvas.
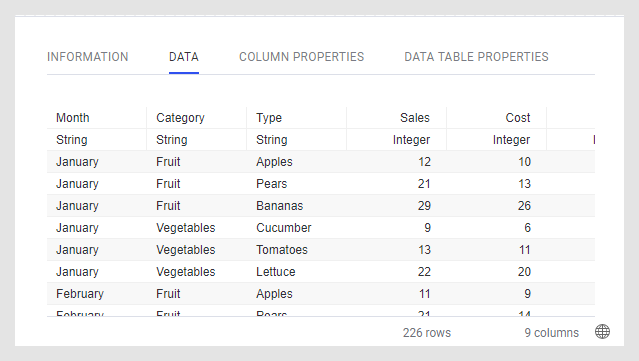
By looking at the Data tab in the lower right part of the data canvas, you can see a preview of the imported columns.
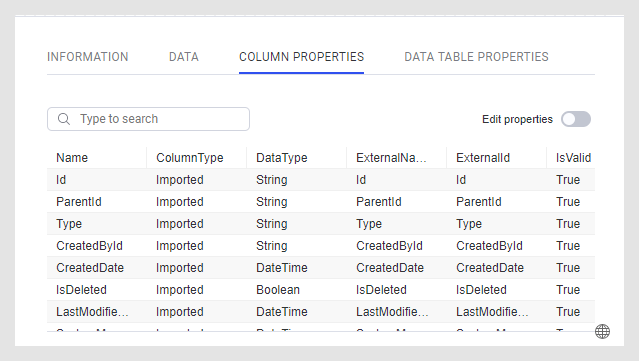
On the Column properties and Data table properties tabs, you see the current value of the properties, and for the final data table node, you can change the value of a property.