Limiting the data in a visualization using filterings
The data limiting settings of a visualization let you define how different filtering schemes in the analysis should affect the visualization. Using data limiting, you can make visualizations on a single page respond to different filtering schemes, or not be affected by filtering at all.
Before you begin
About this task
By default, filter settings are the same in the entire analysis. If you want to apply various filter settings on different pages, filtering schemes can be created. Which filtering scheme to use on a page is selected at the top of the Filters panel (installed client only).
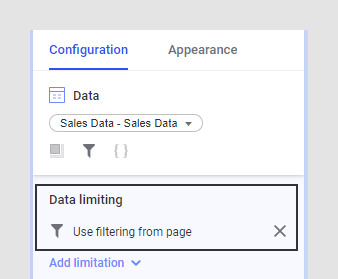
The Use the current filtering from the page limitation is added by default when creating a new visualization, and it makes the visualization always respond to the filtering scheme that is used on the page where the visualization is located. If you move the visualization to a new page, then the visualization will automatically start reacting on the filtering scheme that is used on the new page.
To remove all filtering from a visualization
You can configure a visualization not to respond to any filtering at all. For example, if you want one visualization on a page to always show all the available data.
Procedure
-
Click to expand the
Data card and, under
Data limiting, click the
 next to
Use the current filtering from the page (and
the
next to any other
filtering limitation that might have been added).
The visualization is no longer limited by any filtering.
next to
Use the current filtering from the page (and
the
next to any other
filtering limitation that might have been added).
The visualization is no longer limited by any filtering.
To make a visualization respond to a specific filtering scheme
You can select a specific filtering scheme from the list if you want the visualization to always respond to the filtering done using that filtering scheme. Moving the visualization to another page with a different filtering scheme will not affect this setting; the visualization remains tied to the specified filtering scheme.
Procedure
-
You probably want to remove the default limiting by clicking the
next to
Use the current filtering from the page, as
described above.
To use more than one filtering scheme for data limiting
If you select to limit data using more than one filtering scheme, the intersection of the filterings will be used. This means that the visualization will show only the data that is made visible by all of the specified filtering schemes.