Adding measures to the statistics table
You can decide which statistical measures to show in a box plot.
Procedure
-
Click
Add measure to add a new statistical measure.
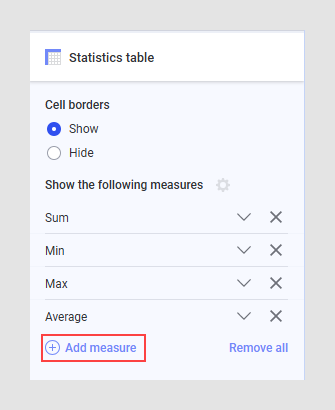
-
Edit the expression to show the desired statistical measure. Click
 for suggestions or to open
the expression editor. See
Statistical functions
for more help on how to write statistical measures as expressions.
for suggestions or to open
the expression editor. See
Statistical functions
for more help on how to write statistical measures as expressions.
Results
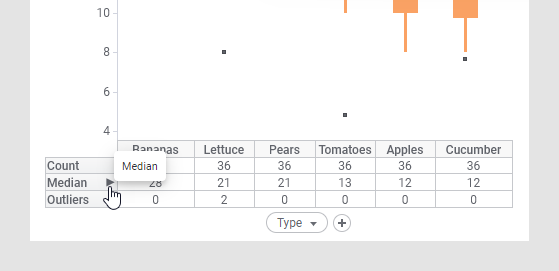
You can select which measure to sort the table by and whether to sort ascending or descending by either clicking directly on the measure in the visualization or under Sort by in the Category axis card.
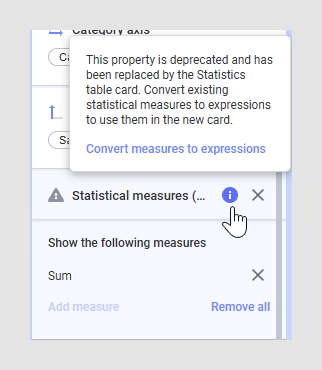
Important: If you have configured a box plot using an earlier
version of the statistical measures settings (the
Statistics Table page in the visualization
properties dialog or the
Statistical measures card in the visualization
properties panel), you must convert the measures to expressions to use them in
the
Statistics table card described above. This
applies to Spotfire versions older than 14.6.0. On the
Statistical measures (legacy version) card,
hover over the
 icon and click
Convert measures to expressions in the tooltip.
icon and click
Convert measures to expressions in the tooltip.
Note that once you have converted the measures to expressions and saved the analysis, it might not work as expected when you open the analysis again in a Spotfire version older than 14.6.0.