Using OVER statements in calculated columns
You can perform calculations on your data, and display the results as values in a new column that is added to the data table. In the expression used for the calculation, you can use an OVER statement. However, using the OVER statement in calculated columns works differently from using it in custom expressions. In calculated columns, the OVER expression is used to calculate separate, fixed, values for different groups and the OVER expression might cause the data to be 'sliced into fewer records'.
When you work with calculated columns, there are no axes available to navigate over, as in the case with custom expressions. Instead, you use the OVER expression to refer to a data column (or hierarchy), and you calculate one result for each category in the column or hierarchy.
Use the following data as an example:
Year	Fruit	Sales
2020	Apples	30
2020	Pears	40
2021	Apples	70
2021	Pears	10
2022	Apples	100
2022	Pears	50
If you create a simple calculated sum of sales, the new column will show the same result on all rows in the data table:

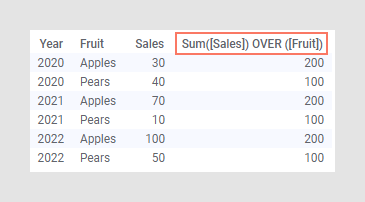
If you instead use the expression
Sum([Sales]) OVER ([Fruit])
for the calculated column, you will get the total sum of sales for each type of fruit as the calculated result:

Extended example
The calculated column with fewer records might not be very useful as a standalone column. However, let us add another column, where the previous expression is a part of the expression used:
[Sales] / (Sum([Sales]) OVER ([Fruit]))

This expression calculates each sales transaction's relative contribution to the total sales over the years within its fruit type. For example, 15% (30/200) of the total apples sales was in 2020, 35% (70/200) in 2021, and the rest, 50% (100/200), in 2022.
In the bar chart below, the calculated column is selected on the Value axis using the Sum aggregation.

In fact, this result is the same as using the 100% stacked bars option in a bar chart showing Sum([Sales]).
Combining OVER with a node navigation method in a calculated column
In the expression used for calculating a column, you can use the OVER
statement in combination with a
node
navigation method. This simple example gives you an idea how to use one
of the methods,
Previous().
The data table lists weekly measured weights for a newborn child, visualized in a line chart.


Assume you are interested in the weekly growth. This can be calculated using the expression:
[Weight (g)] - Sum([Weight (g)]) OVER
		(Previous([Week]))
The results can be viewed in the data table and bar chart below.


More examples of calculated columns
If you have multiple sales transactions each day, you could use 'OVER'
to aggregate those values into one value for each day, the daily sales, using
the expression(Sum([Sales]) OVER [Date]):

By combining OVER with functions such as
All,
AllPrevious,
LastPeriods, etc., you can obtain just about any type
of grouped values. For example, the expression
Sum([Sales]) OVER AllPrevious([Date]) will give you
the cumulative sum of sales for all dates in the column 'Date'.

If you want subgroups for the results to be defined by values in more
than one column, and the values from either of those columns make use of any of
the OVER functions, then you must also use the
Intersect function. For example, to be able to obtain
the cumulative oil production per well and year in a data table with oil
production data for a number of wells, you would need to intersect the well and
year:
Sum([Oil Production]) OVER Intersect([Well ID],
		AllPrevious([Year]))
.
When you are referring to a hierarchy within an expression, the nodes
in that hierarchy become similar to the nodes on an axis (compare to custom
expressions), and you can specify which nodes to compare using functions such
as
All,
Previous,
Parent, etc. Hierarchies are referenced in expressions
using the syntax
Hierarchy.HierarchyName. For example, with a hierarchy
called 'TimeHierarchy', containing Year and Quarter, the expression
Sum([Sales]) OVER (Parent([Hierarchy.TimeHierarchy]))
would return the sum of sales per year.
| Example | Expression |
|---|---|
| Average sales per category and year |
Avg([Sales]) OVER ([Category], [Year])
|
| Average sales per category for all years, up until the current year |
Avg([Sales]) OVER Intersect([Category],
						AllPrevious([Year]))
|
| Peak oil per well |
Max([Oil Production]) OVER ([Well ID])
|
| Cumulative oil production per well and year |
Sum([Oil Production]) OVER Intersect([Well ID],
						AllPrevious([Year]))
|
| Sum of sales for top level of a hierarchy |
Sum([Sales]) OVER (Parent([Hierarchy.TimeHierarchy]))
|