The visualization properties panel
You can work with most visualization properties from the contextual visualization properties panel.
The panel
The contextual panel is opened (or updated to properties for a
different visualization) if you click
Properties
![]() in the title bar of a
visualization, or right-click on a visualization and select Properties.
in the title bar of a
visualization, or right-click on a visualization and select Properties.
In the installed client, it is possible to change the default to use the dialog instead of the panel, see the end of this topic. If that has been done, the panel can still be opened by selecting .
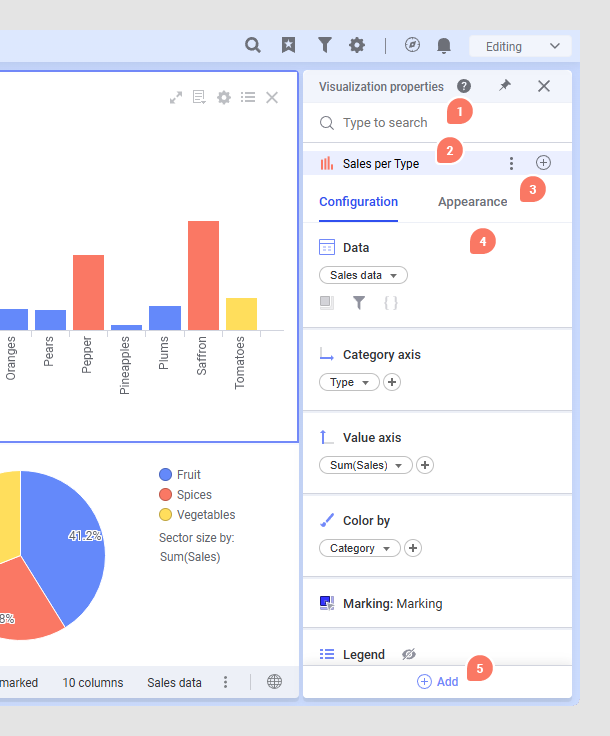
- Search bar - Use the search bar to find properties and settings that have been configured for the selected visualization or visualizations. The search results also show all properties that are applicable to all selected visualizations and that you can add to the panel.
- Visualization titles, layers, dynamic items, etc. - The title of the selected visualizations. Some visualizations can contain several subsections, such as layers (map chart) or dynamic items (graphical table).
- Tabs - The properties are split into two categories, Configuration, and Appearance.
- Property cards -
Each visualization property and its related settings are usually contained in
one property card. You can only see those cards in the panel that have been
configured for the active visualization or visualizations. For more details,
see the section below.
Note: For some properties, the settings cannot be configured directly in the panel, but you can always reach the visualization properties dialog from the panel in those cases.
- Add - Use the Add menu to find and add property cards to the panel that are applicable to the selected visualization or visualizations and that have not been configured yet.
The properties cards
Each property card represents one visualization property or setting.
As soon as a property is configured, its card is shown in the panel. To
configure a property and thus add it to the panel, click
 and select the property
you want to apply to the selected visualization.
and select the property
you want to apply to the selected visualization.
The property cards can differ in their behavior and how they can be used. Some cannot be removed and are always configured and present in the panel. If you removed one of these property cards you would break the visualization, for example the Data card or the axes cards (X-axis and Y-axis). Most cards can be expanded to show more settings. Some settings are already accessible in the collapsed state. Other cards are either "on" or "off" and are applied to the visualization immediately. Adding them to the panel acts like selecting a check box or turning on a switch.
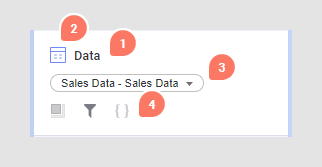
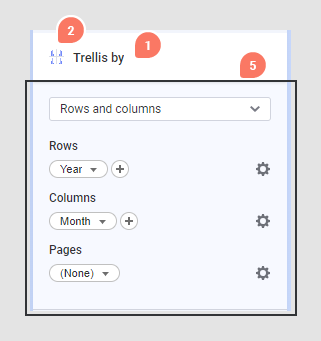
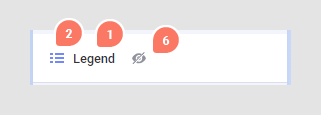
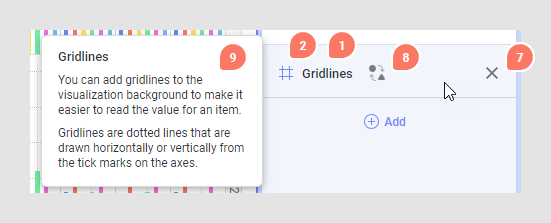
- Card name - Each property has a card name. Some cards have a fixed, type-based name, such as X-axis or Category axis, and some have a dynamic one, for example, Marking.
- Icon - A descriptive icon to quickly locate and distinguish properties. Most of the icons are static but some are dynamic. For example, the Marking icon switches color based on the selected color.
- Column selector or data table selector (some cards only) - A column selector lets you switch the column used in the setting. In the Data card, the selector switches the data table.
- Data limitations (Data card only) - Icons that indicate which data limiting is applied.
- Settings of property - This section becomes visible when expanding the card and it contains the settings.
- Hide - For some cards, selecting Hide from the context menu toggles the visibility of certain properties in the visualization without removing the actual configuration or removing the card from the panel. For example, you can hide the Legend from the selected visualization.
- Remove - When you remove a card from the panel, you remove it from the visualization and clear all configurations.
- Synchronize settings - Synchronize the settings between all selected visualizations and choose which visualization's settings should be applied to all selected visualizations.
- Help tooltip - Hover over a card or a setting to show a help tooltip that contains useful information.
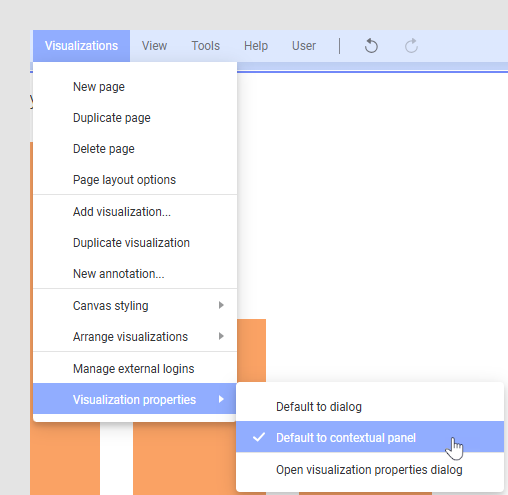
Using the visualization properties dialog as default
An administrator can switch to use the dialog as default by setting
the
Default to contextual visualization properties panel
preference to
False in the Administration Manager, under
.
The dialog will then be opened, for example, when you right-click a
visualization and select
Properties from the menu, or when you click the
properties icon
![]() in the toolbar or the
visualization title bar. When the preference is set to
in the toolbar or the
visualization title bar. When the preference is set to
True, the contextual panel will be the default in the
installed client. The contextual panel is always used in the web client.
If the panel is set to be the default experience, you can still reach the visualization properties dialog from this menu.