If you have a Google Analytics account, you can access and
analyze data from Google Analytics in Spotfire.
Before you begin
You must have access
to a Google Analytics account.
Procedure
-
On the authoring bar, click
Files and data
 .
.
-
In the Files and data flyout, click
Connect to and select
Google Analytics.
-
In the Google Analytics flyout, click
New connection.
-
Follow the login instructions in the dialogs that are displayed.
That is, choose or add an account, provide credentials when necessary, and
allow access.
-
In the next dialog that is displayed, select which Google
Analytics view you want to load data from.
The selected view will become a data table in Spotfire.
-
Click
Continue.
-
In the left part of the dialog, all the metrics and dimensions are
grouped together in categories. Click on the plus sign next to the category
name to expand a category and see the metrics and dimensions.
-
Select the metrics and dimensions of interest.
Note: You can select a
maximum of ten metrics and seven dimensions. This is due to a limitation in
Google Analytics. Note that some combinations of metrics and dimensions will
not be valid. For the latest information about which combinations are valid,
see the official documentation for Google Analytics.
The selected metrics and dimensions are added to the list
to the right in the dialog.
-
Optionally, you can change what
Segment to load data for. By default, the
segment
All Users is selected.
System segments are segments that are
available to all users of the same account.
Custom segments are segments that have been
defined by yourself or your company.
-
Optionally, you can change what
Date range to load data for.
By default, the predefined range
Last 30 days is selected, but you can change
to another predefined range, specify your own range, or select to
Let the end user specify range.
-
Click
OK.
The selected data is added to the summary view in the
flyout.
-
In the flyout, you can change the name of the new data table.
Click
OK when you are satisfied.
The selected metrics and dimensions are loaded into
Spotfire.
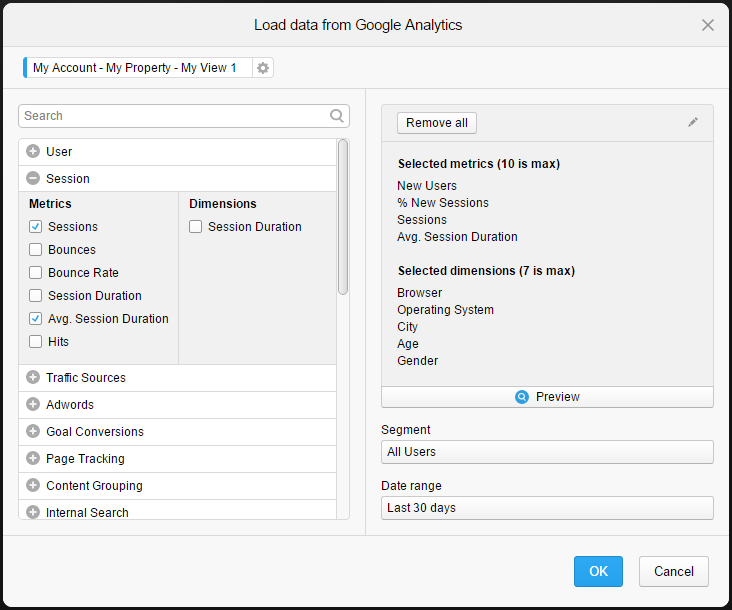
The Load data from
Google Analytics dialog
In this example, data will be loaded from My Account > My Property
> My View 1. This data will become a data table when loaded into Spotfire.
The left side of the dialog shows the available
Metrics and
Dimensions divided into categories. The category
named
Session has been expanded, and two metrics have
been selected,
Sessions and
Avg. Session Duration. In the right part of the
dialog, all the selected metrics and dimensions are listed; in this case four
metrics and five dimensions. Each metric and dimension will become a column in
the new data table. To rename columns, click on the pencil icon. In the lower
right part of the dialog,
All Users has been selected as the
Segment and
Last 30 days as the
Date range.
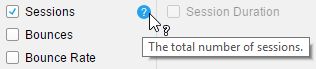
Tips
To read a description, point to the question mark next to a metric or
dimension name.
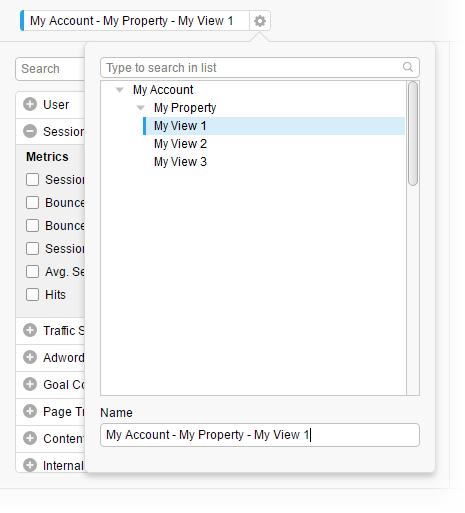
By default, the name of the data table is made up of the names of the
selected account, property, and view. In this example, the name of the data
table is
My Account - My Property - My View 1. To change
the name of the data table, click the settings icon to the right of the name.
In the popover, you can change which view to load data from and you can rename
the data table.
Tip: You can
go back and edit the settings in this dialog from the Data canvas. See
Editing a data connection for more information.