Cross table
Cross tables are used to summarize large amounts of data, and then present the result in a structured table format.
The cross table is a grid of cells defined by a Vertical axis and a Horizontal axis. On these axes, data columns are specified to organize the data.

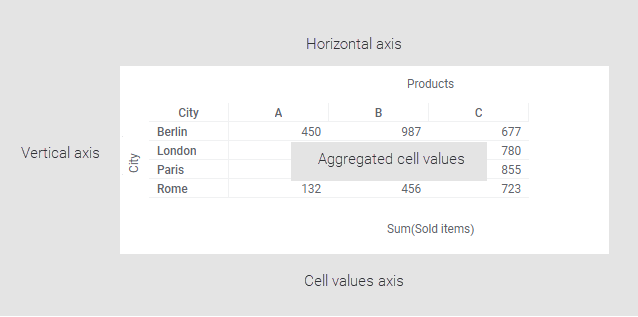
The actual contents of the table cells are aggregated values, for example, sums or averages of the data, defined by the intersection of the two axes. What data you want to aggregate is selected in another axis, the Cell values axis.
- Creating a cross table
Cross tables are used to summarize large amounts of data, and then present the result in a structured table format. - Displaying totals
You can display grand totals for columns as well as rows in a cross table. If the vertical axis is hierarchically structured, it is possible to display also column subtotals for different levels in the hierarchy. - Changing height and width in tables
You can change row height and column width in tables and cross tables to better suit your content. - Sorting values in a cross table
In a cross table, the calculated values in the columns as well as the rows can be sorted. - Styling in the cross table
You can change the appearance of the cross table in many different ways. - Marking values in cross tables
When you want to further explore the data summarized in the cross table cells, it is possible to, at the same time, mark all cell values in a column or in a row.
Parent topic: Visualizations